
Turn Data Into Profitable Decisions
Complete analytics and profitability platform for e-commerce brands. See exactly where every dollar goes, from acquisition to lifetime value.
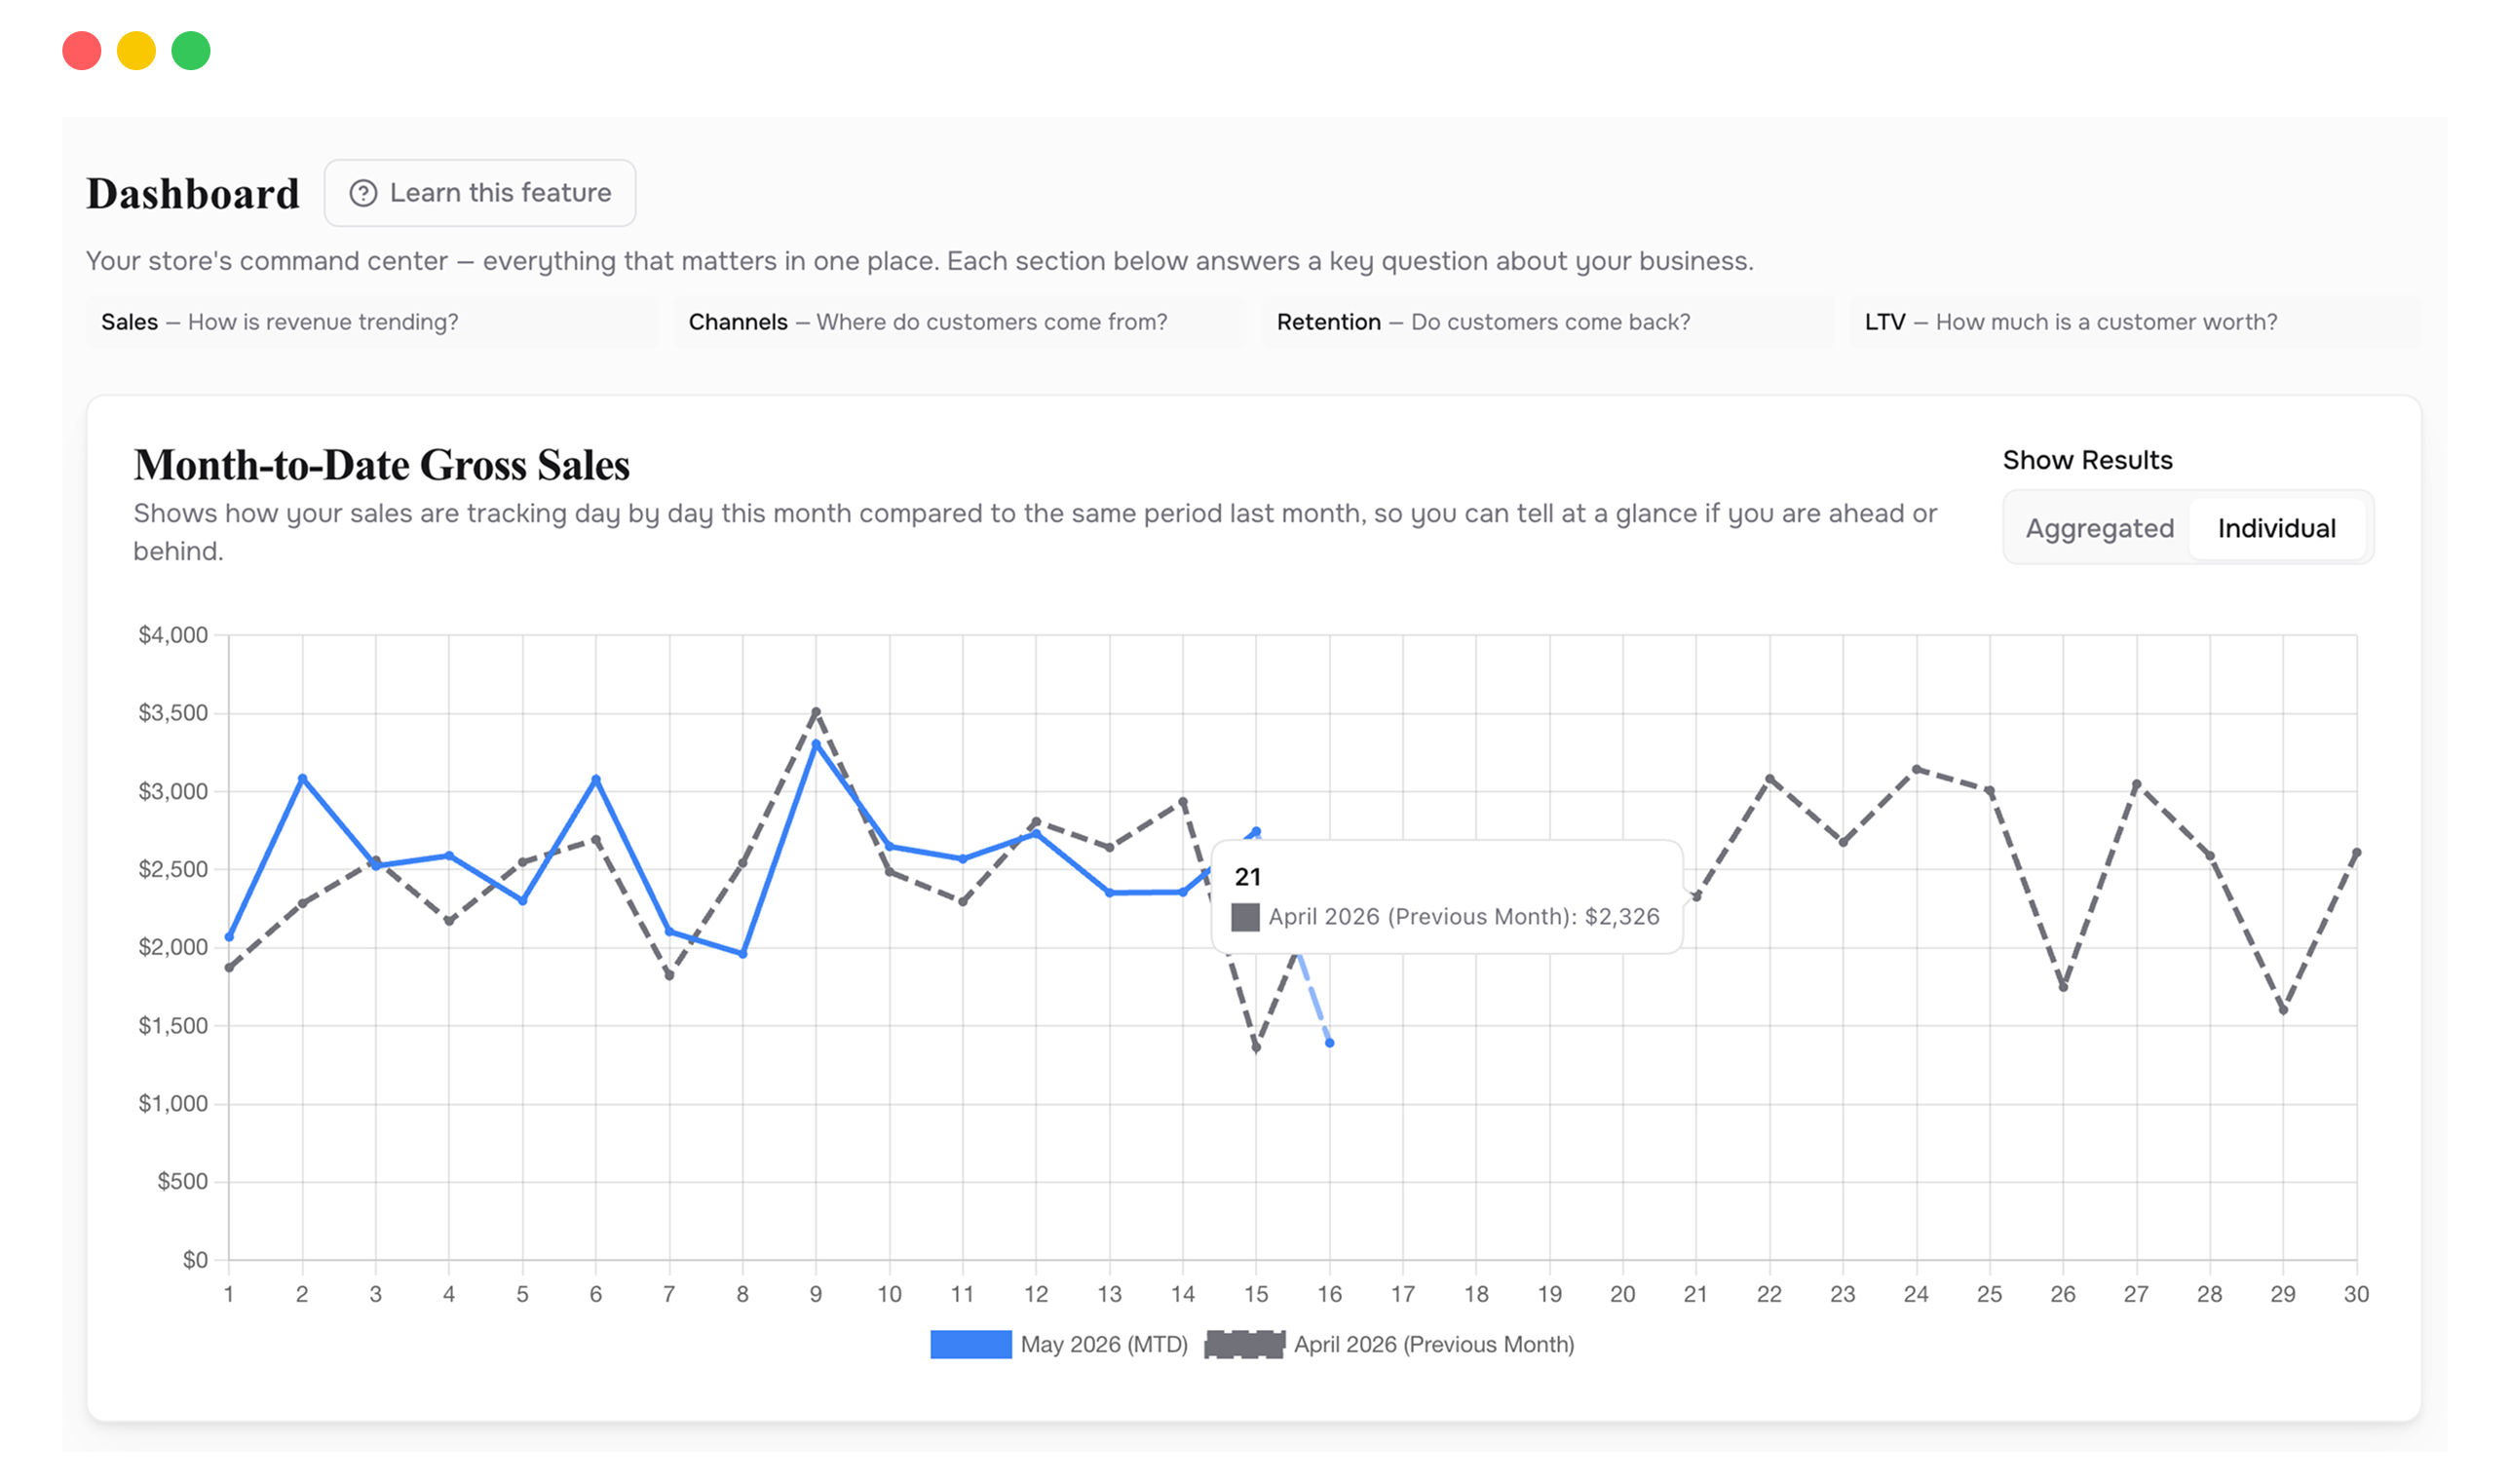
Dashboard
Your store's command center. Month-over-month sales, customer lifetime value, repeat rate trends, and top acquisition channels, all in one view. Customizable metric cards let you surface what matters most. No more bouncing between Shopify, ad platforms, and spreadsheets to get the full picture.
- Month-over-month sales with daily comparison.
- Weighted average LTV across customer segments.
- Repeat rate trends that show if retention is improving.
- Top channels by new customer acquisition.
- Drag-and-drop metric cards you can customize to your view.
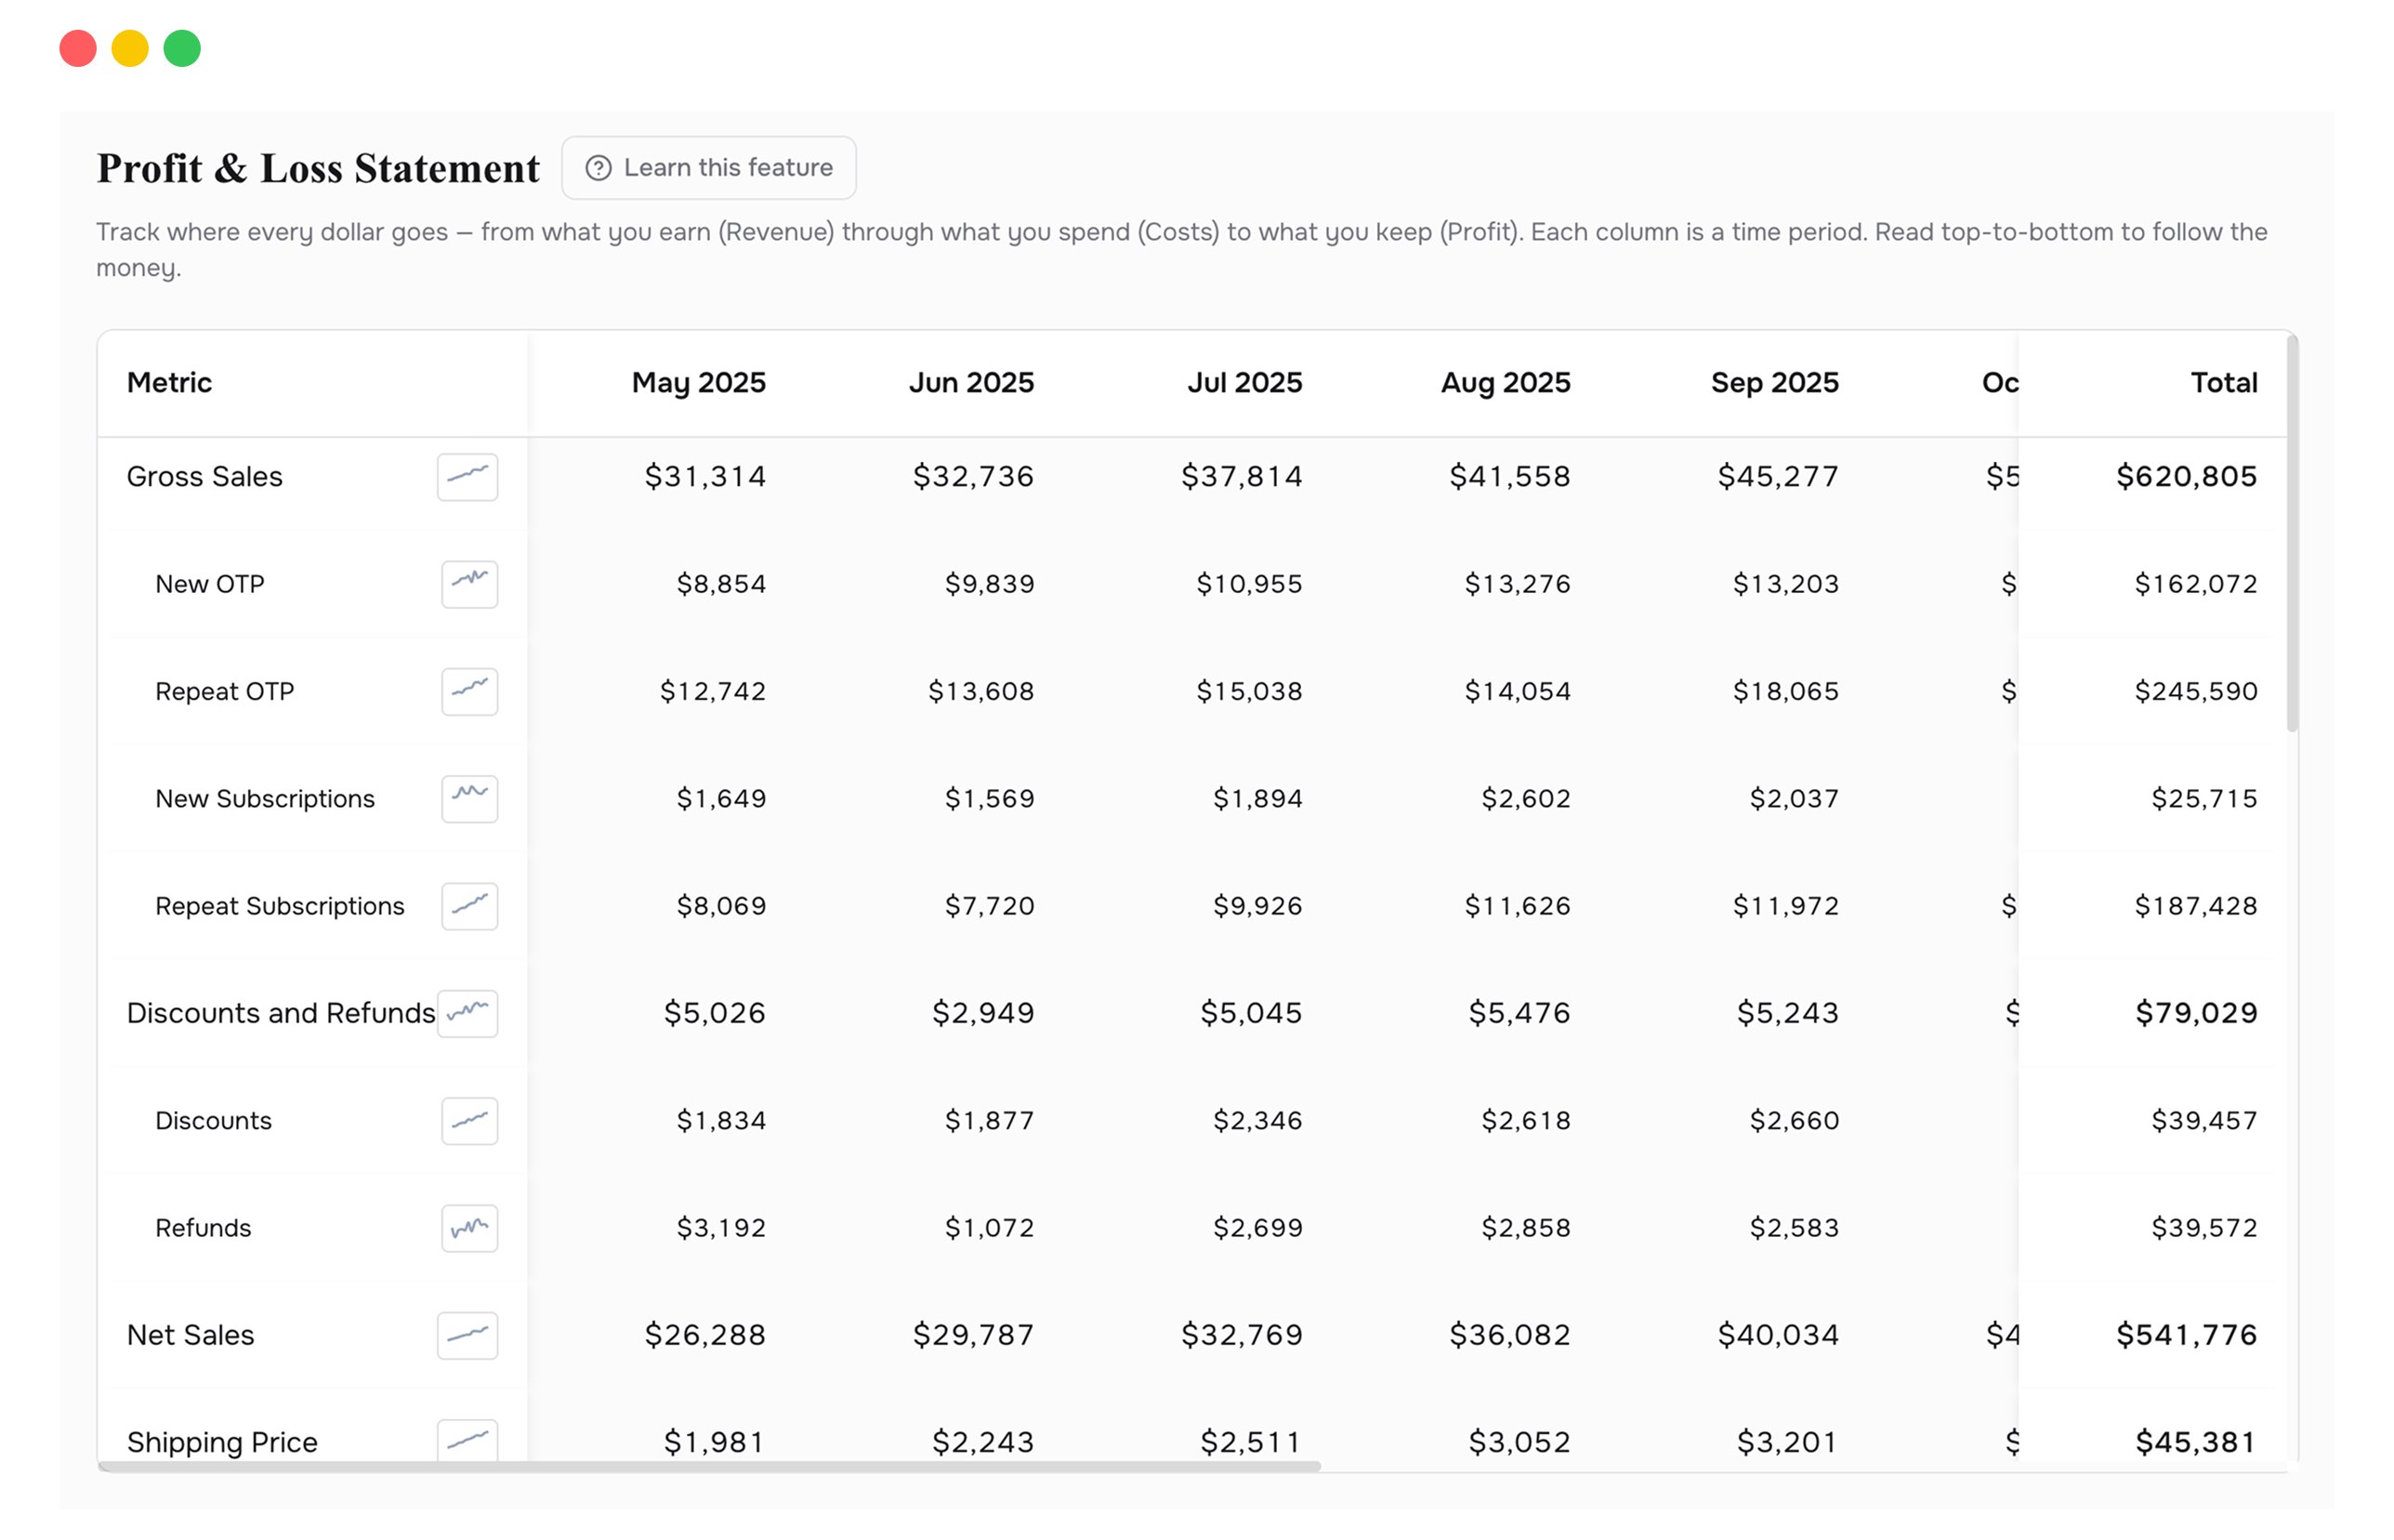
P&L Statement
A detailed financial breakdown of your entire business, from gross sales through every cost layer down to actual net profit. Not "here's your revenue." Here's where every dollar went. Most brands expect 30%+ margins. The table usually shows 5 to 15%. That's the real number.
- Every cost layer: COGS, shipping, fees, marketing, refunds.
- Sparkline trends per metric so you see when margins dropped.
- Switch between dollar and percentage views instantly.
- Split revenue by new vs. repeat customers.
- Export your full P&L to Excel in one click.
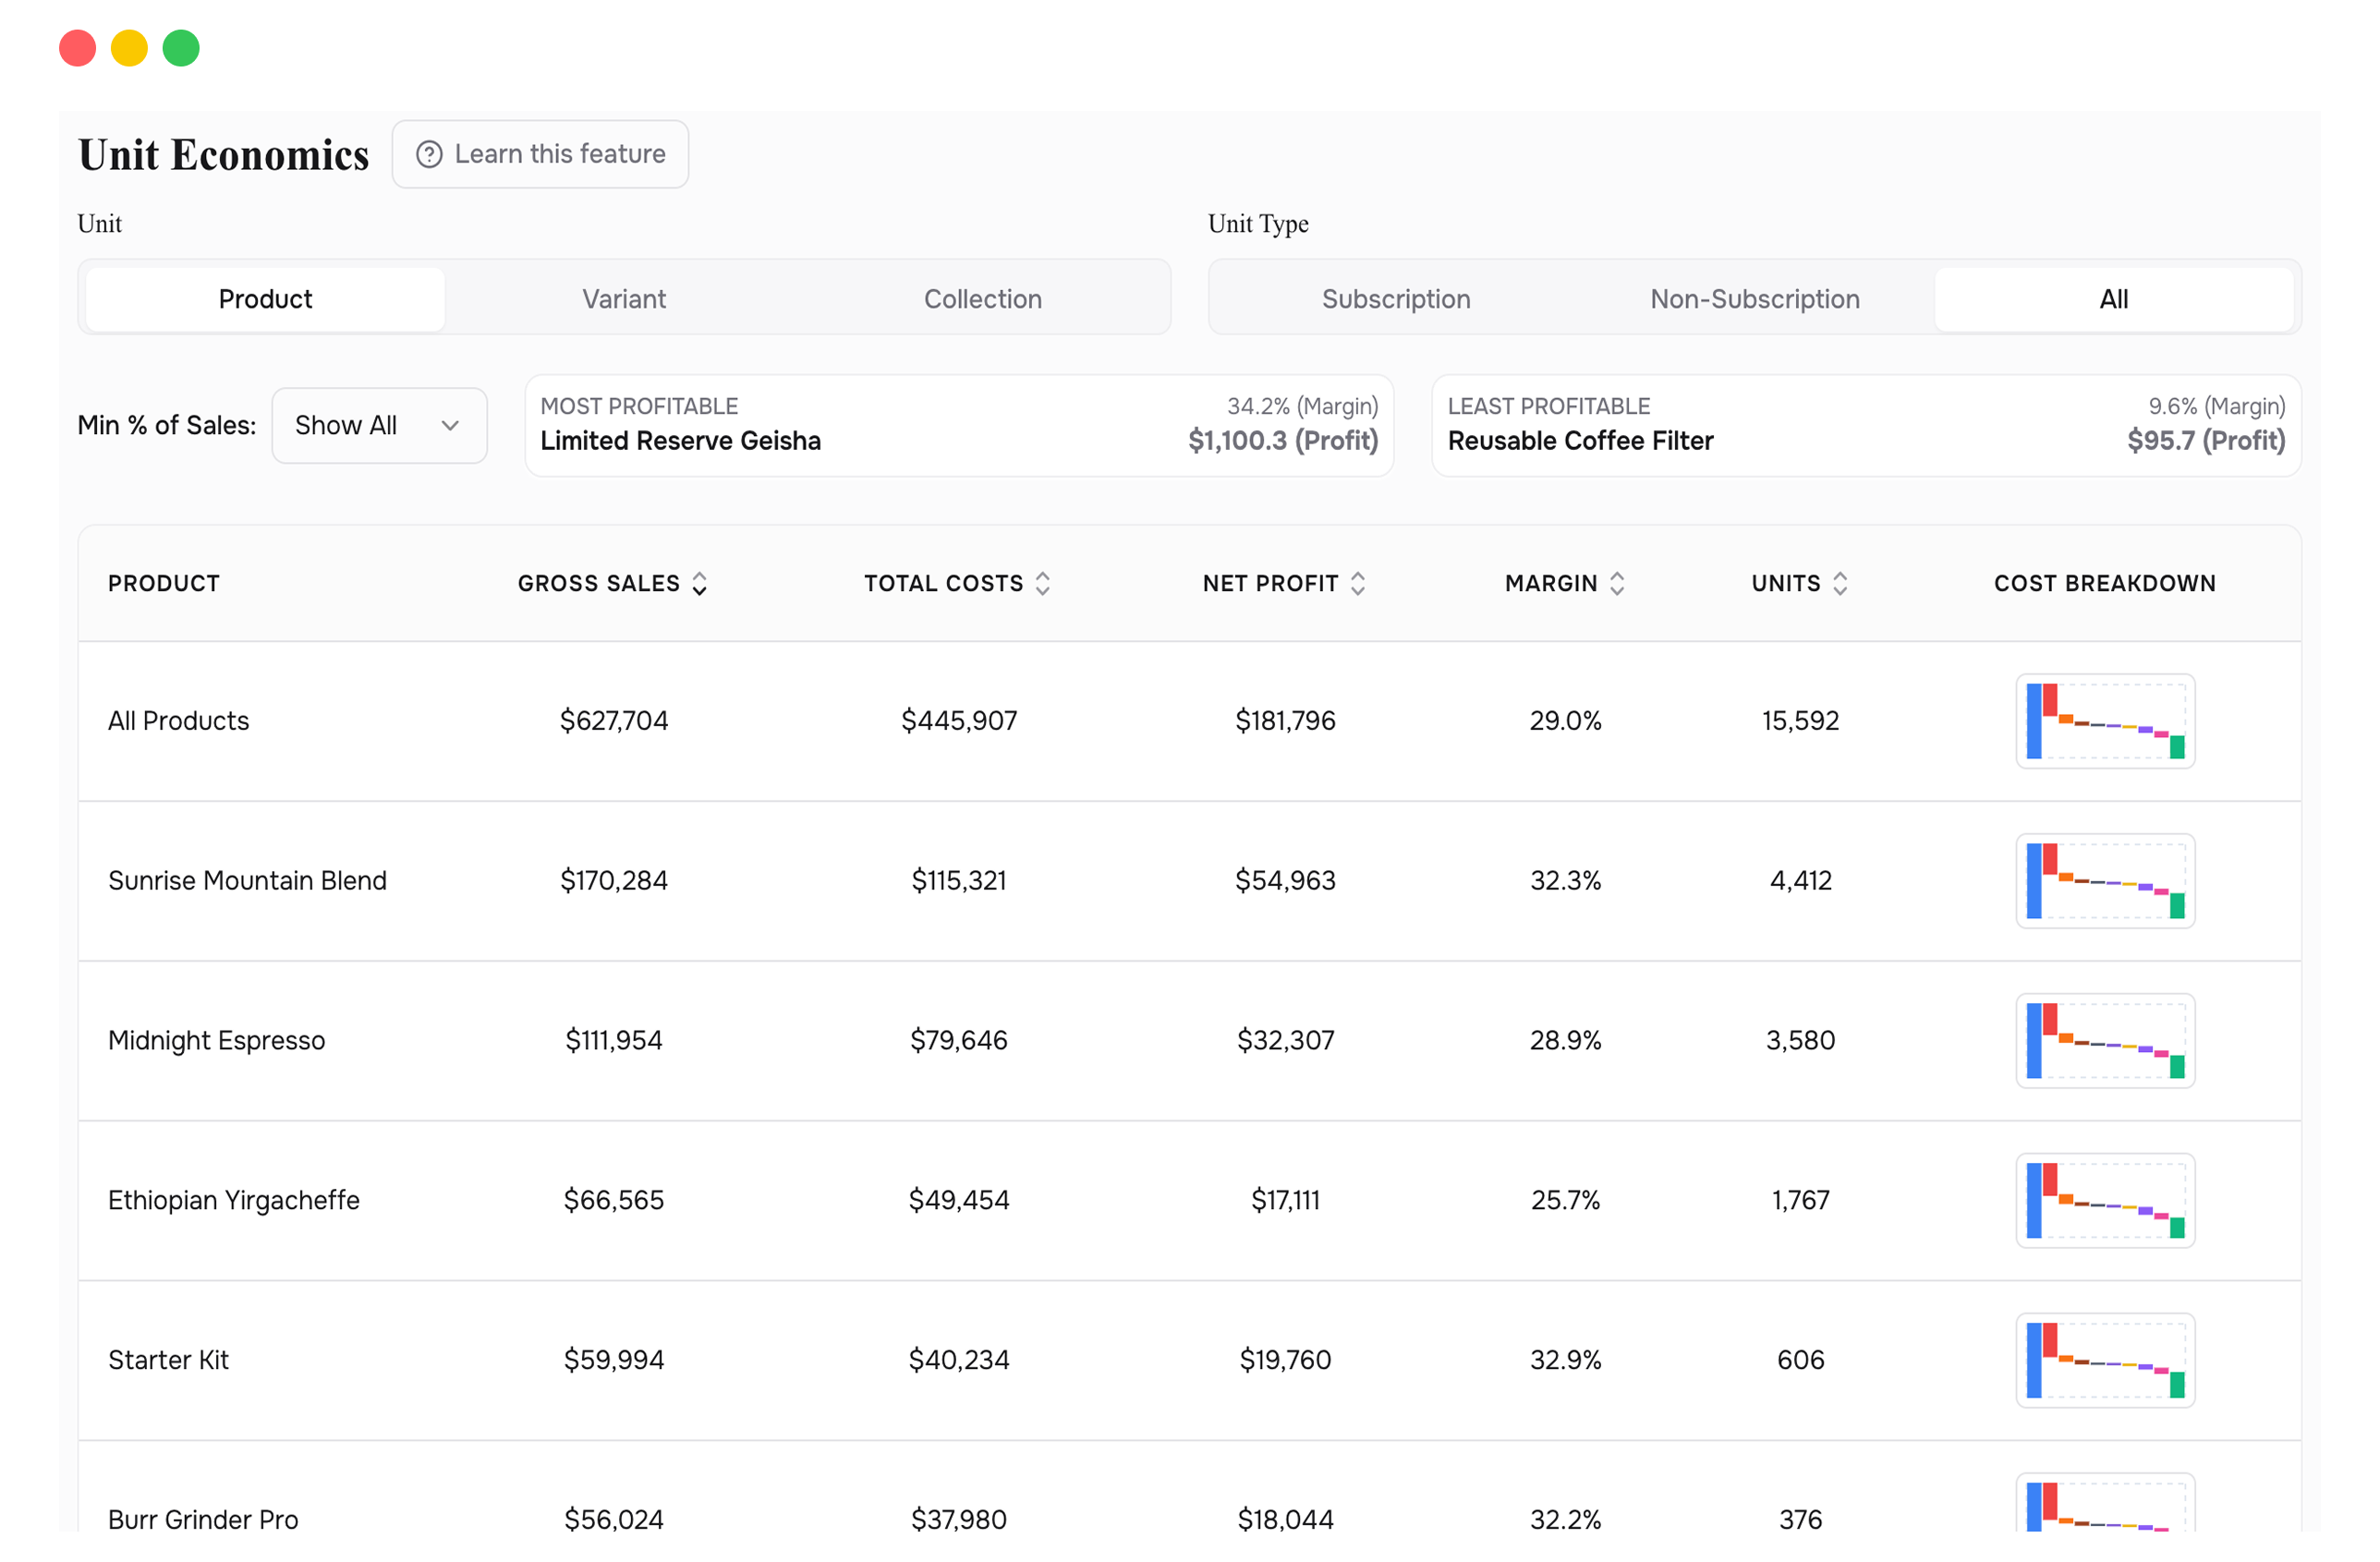
Unit Economics
The profitability of every product, variant, or collection once every cost is accounted for. A product can look healthy by revenue and quietly lose margin through shipping, discounting, or refunds that never show up in your revenue reports. This view shows you exactly where each dollar goes.
- Full cost waterfall from gross sales to net profit per SKU.
- Drill from product to variant to find the real drag.
- Filter by subscription vs. one-time buyer profitability.
- Spot loss-making products before they compound.
- Evaluate what discounts actually cost in margin, not revenue.
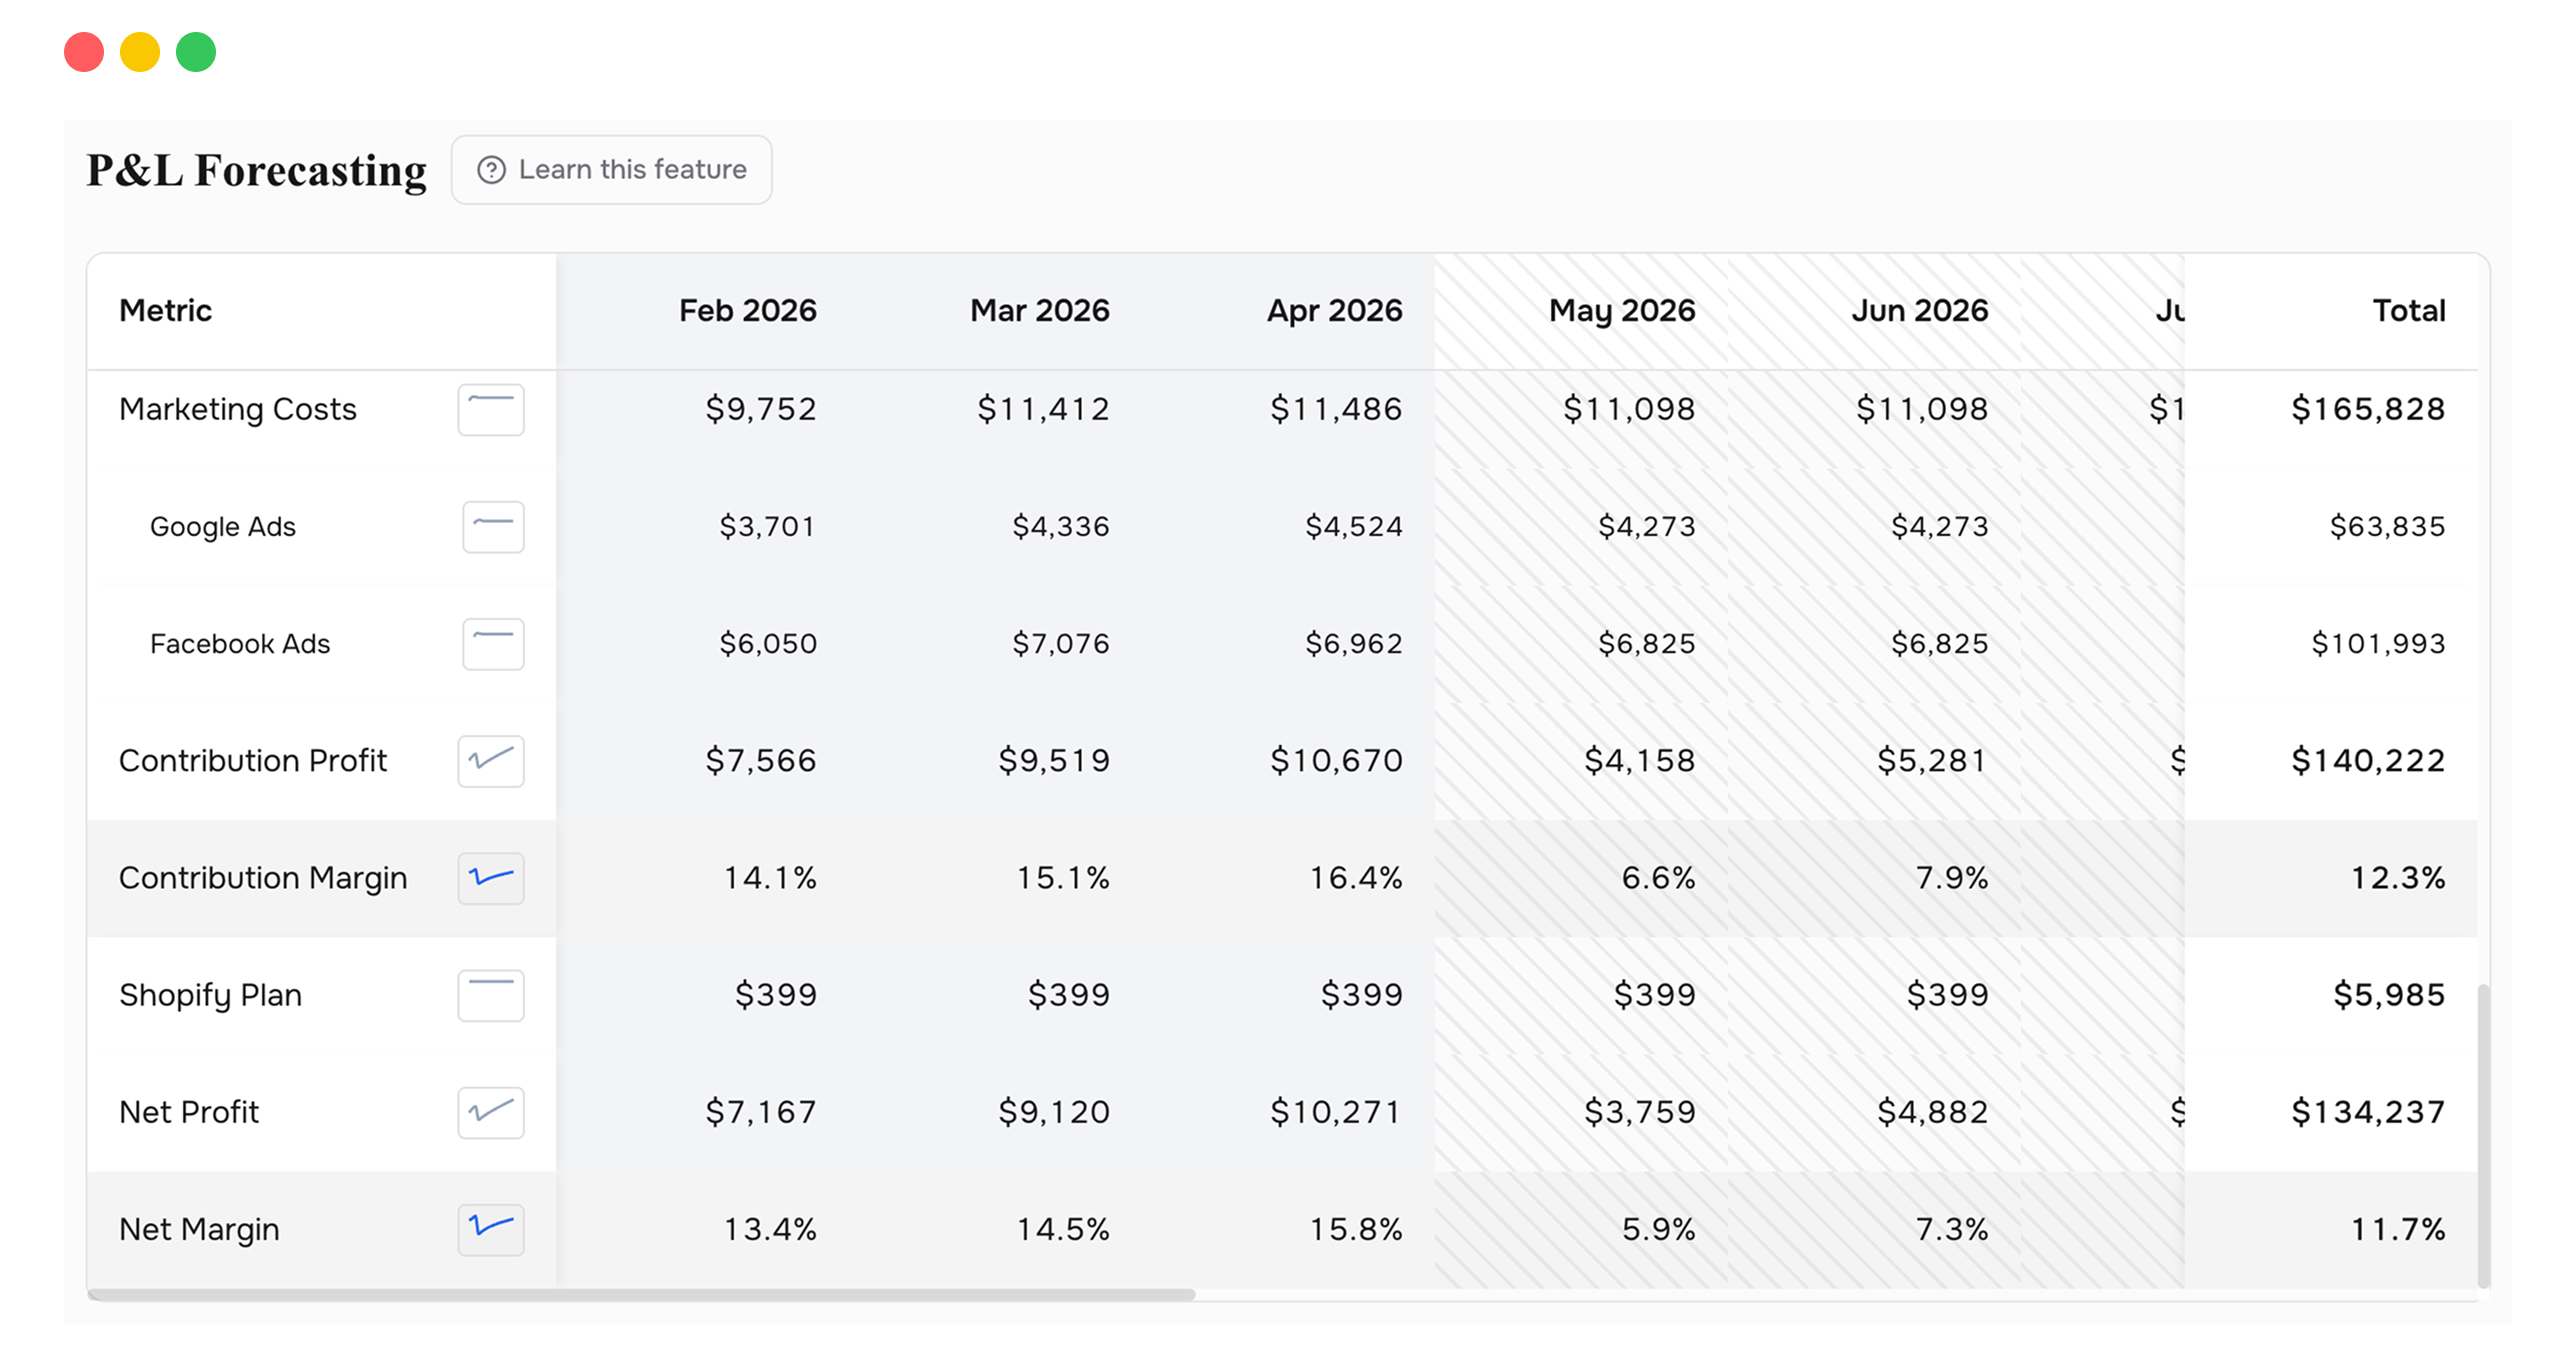
P&L Forecasting
Your complete P&L projected up to 60 months into the future. Takes your real historical numbers, applies revenue forecasting, and shows how profit evolves month by month. If sales go up 20% but profit stays flat, something in the cost structure is eating the gain. This is where that shows up.
- Full P&L forecast: 12, 24, or 60 months ahead.
- Adjust CAC and ad spend, and the forecast recalculates instantly.
- See where growth stops converting to profit.
- Percentage view surfaces margin compression at any scale.
- Historical and forecasted periods side by side.
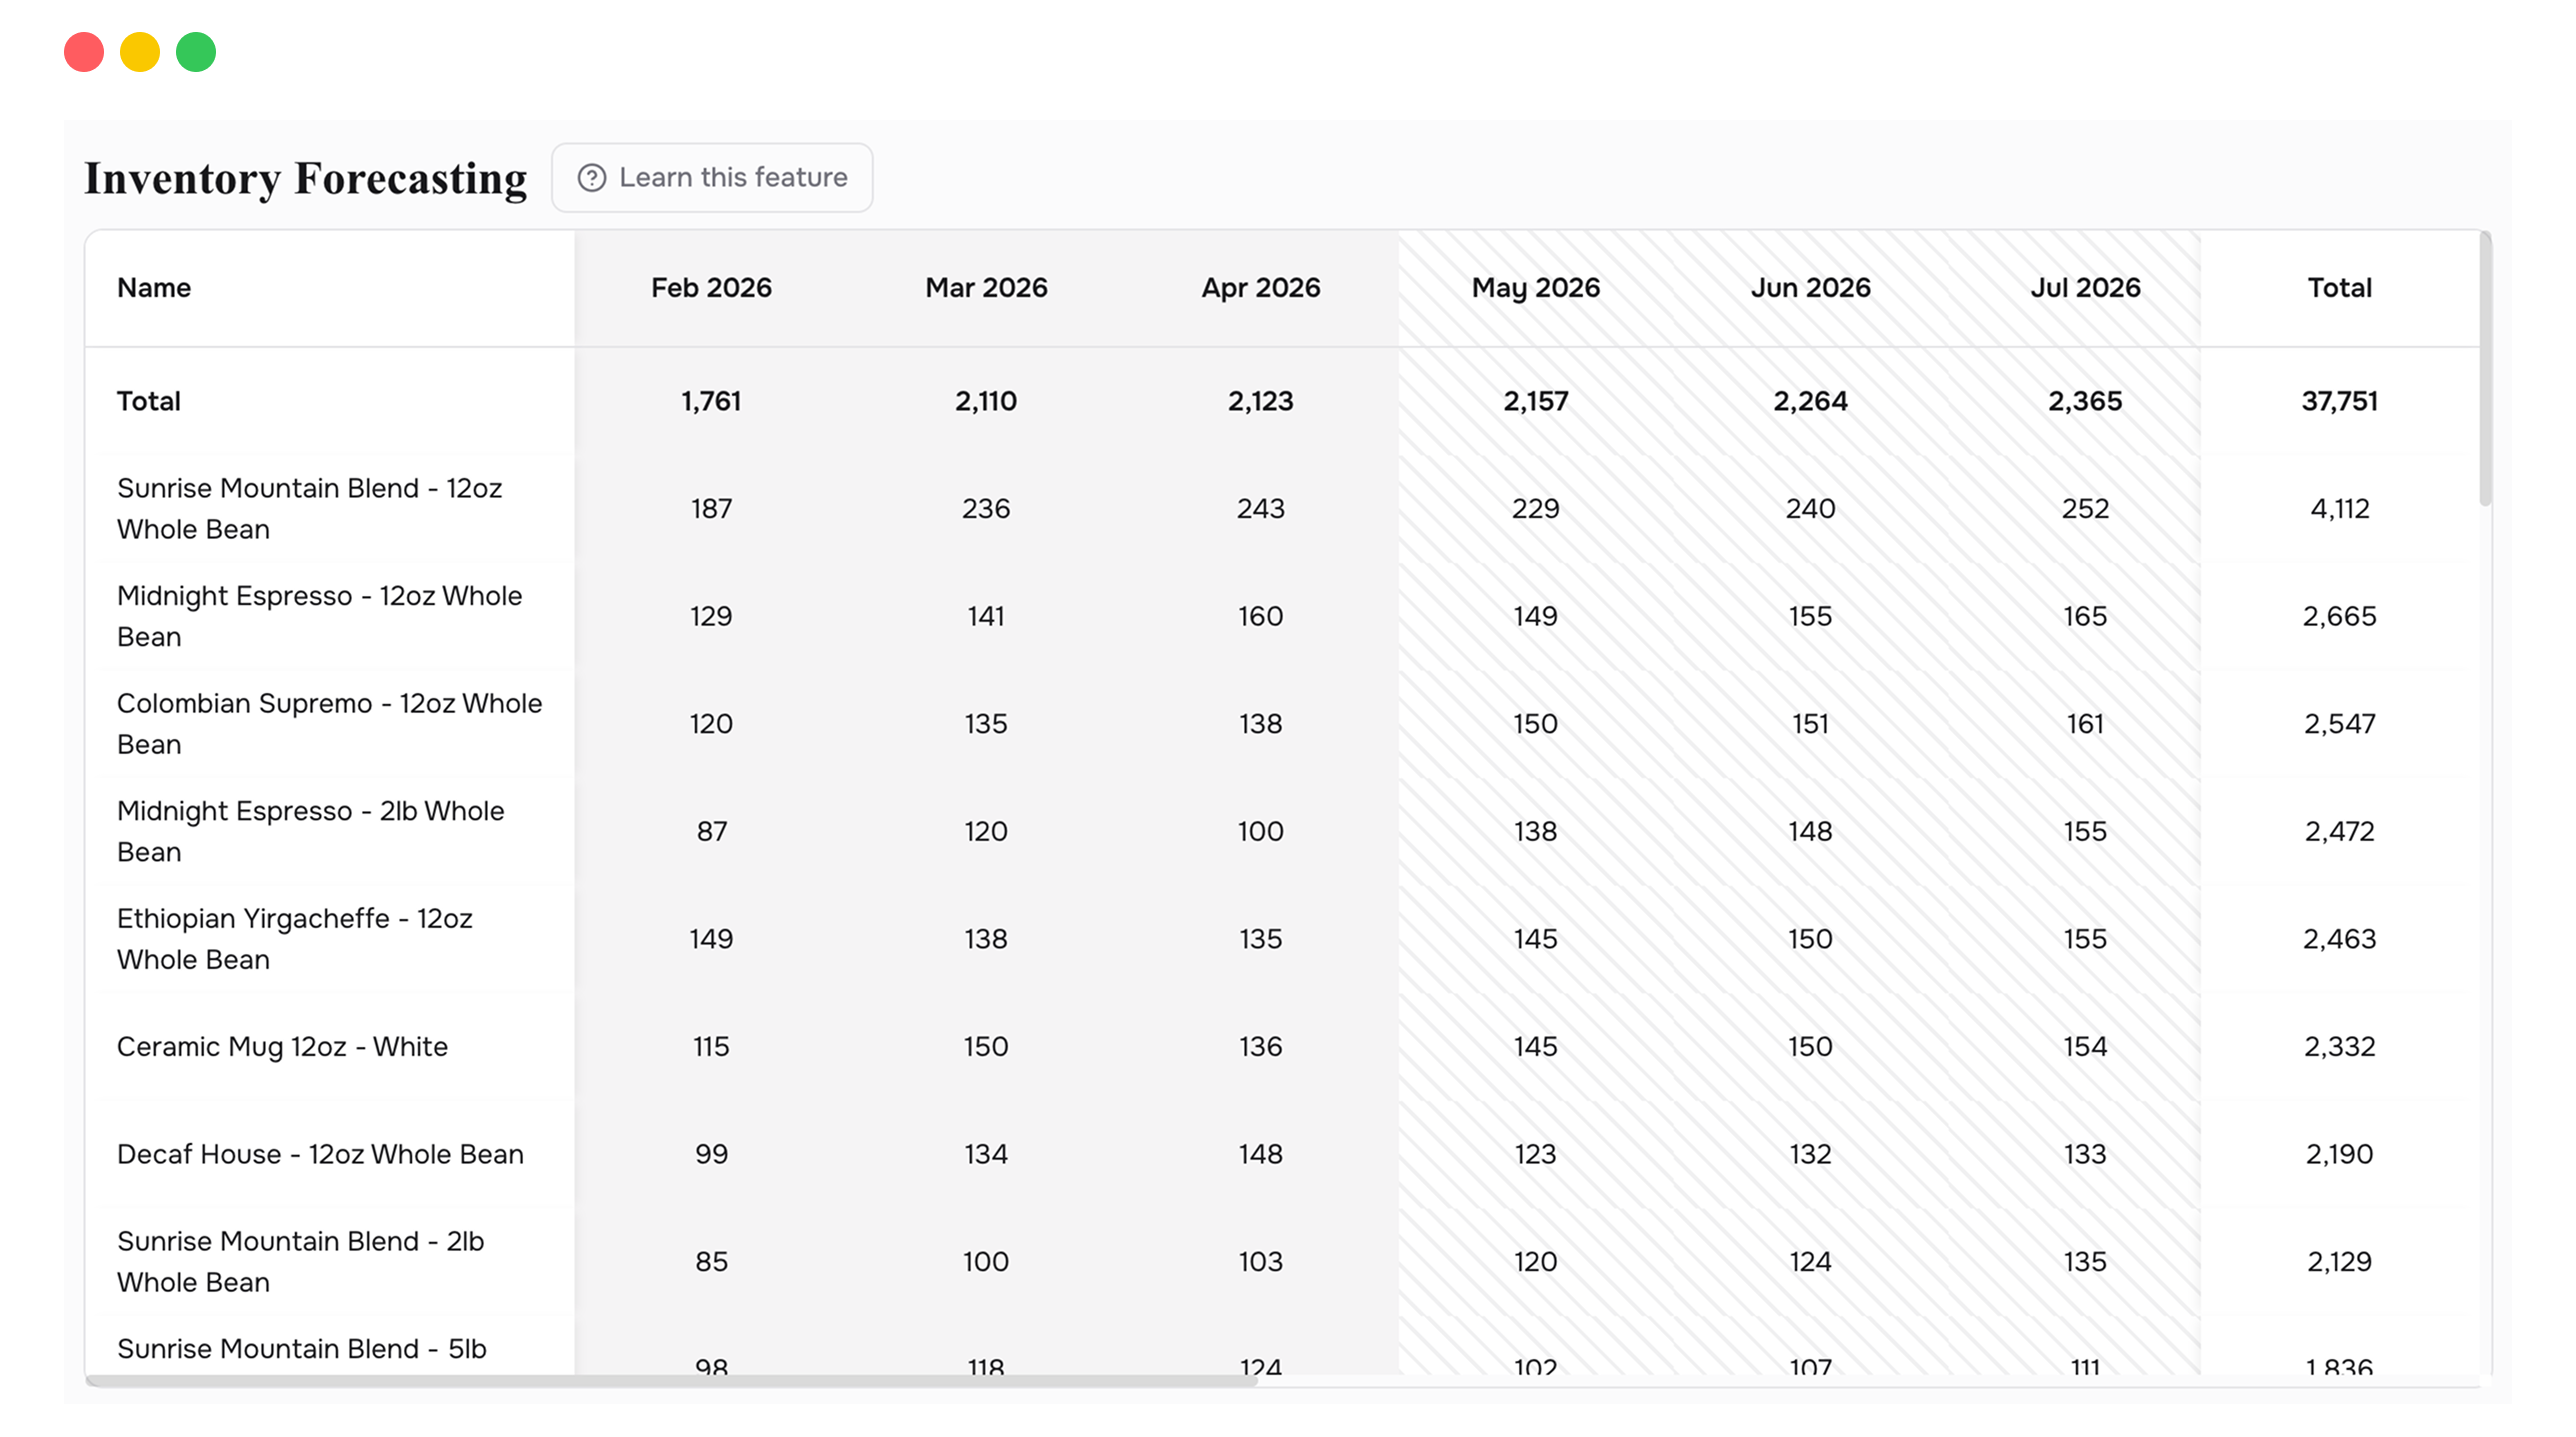
Inventory Forecasting
Month-by-month inventory predictions for each product variant you actually need to stock, based on your sales trends and planned marketing spend. Stop guessing when to reorder. Look 3 to 6 months ahead, place the PO earlier, and stop paying rush fees.
- Per-variant inventory forecast, 12 to 60 months out.
- Tied to actual sales velocity and ad spend assumptions.
- Bundle decomposition: stock components, not finished kits.
- Test marketing scenarios against your supply capacity.
- Export SKU-level forecasts for your supply chain team.
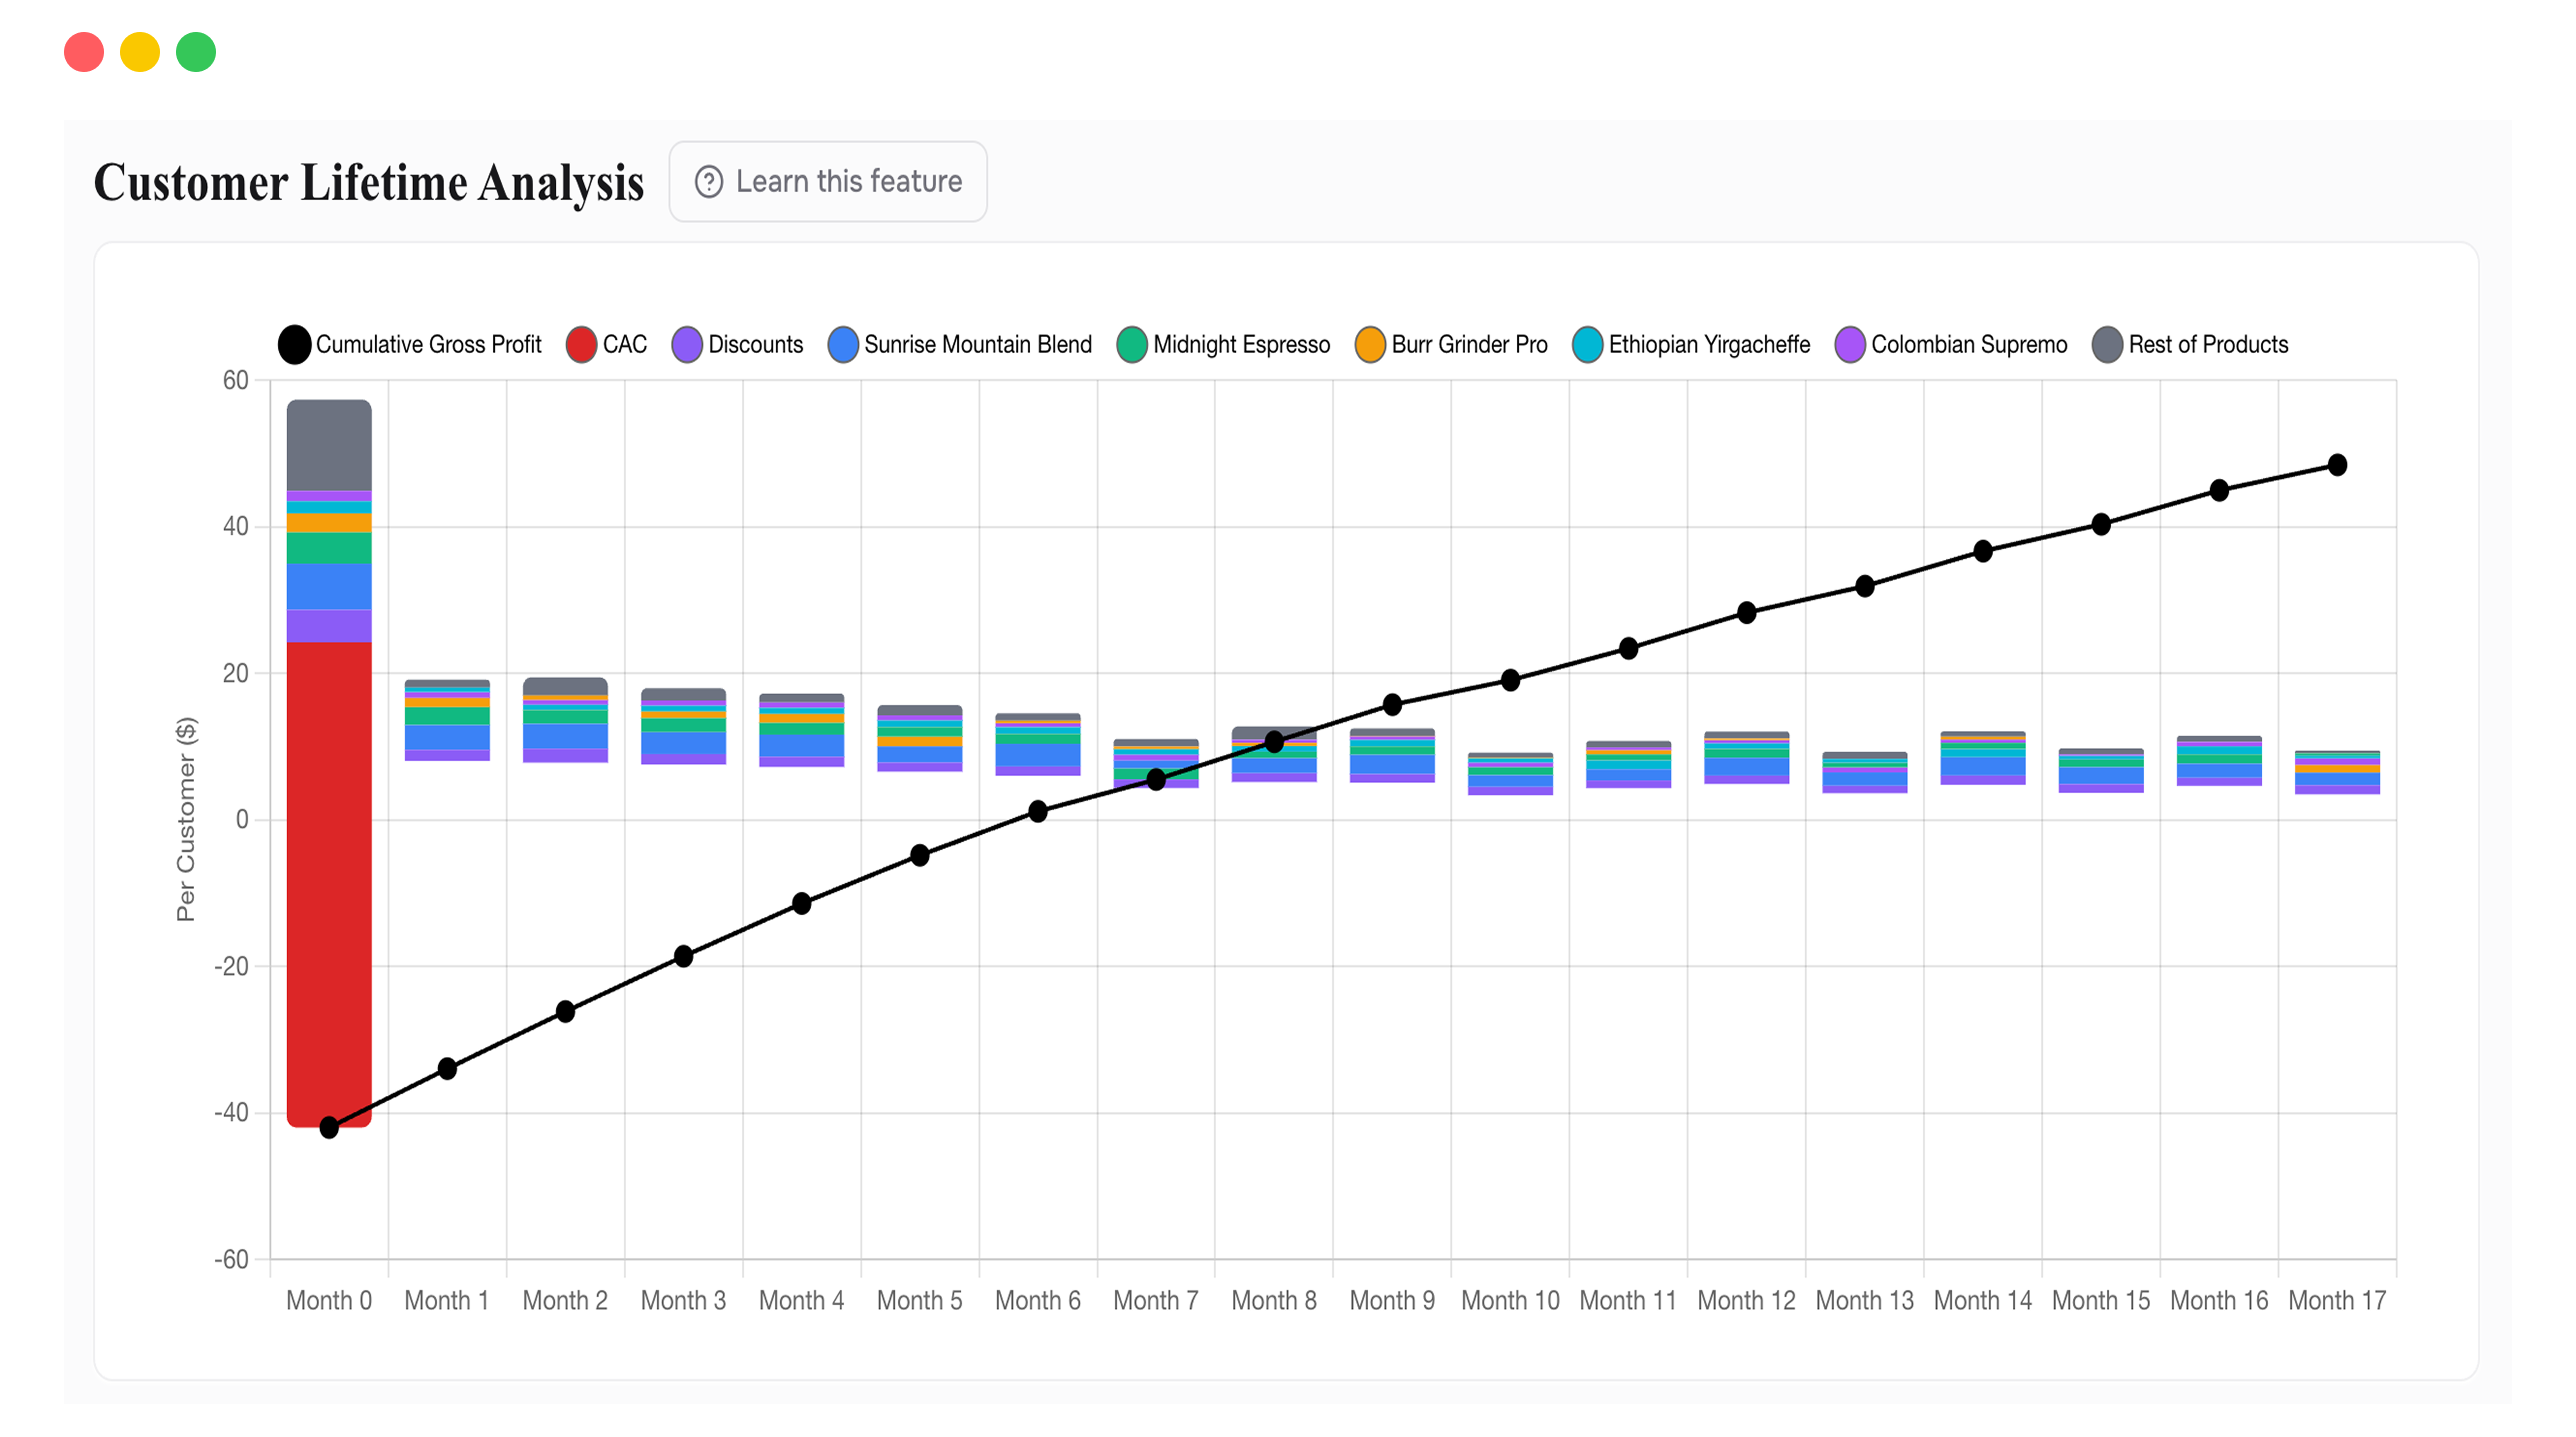
Customer Lifetime Analysis
Tracks how profitable a cohort of new customers becomes over time, from the month they first bought through every subsequent purchase. Shows your real payback period: the month where a cohort collectively moves from loss to profit, after acquisition cost and every cost tied to their orders.
- Cohort LTV built on gross profit, not just revenue.
- Find the exact month each cohort breaks even.
- See which products drive repeat purchase value.
- Compare cohorts to find what made the best ones different.
- Forecast LTV 1 year and 5 years forward.
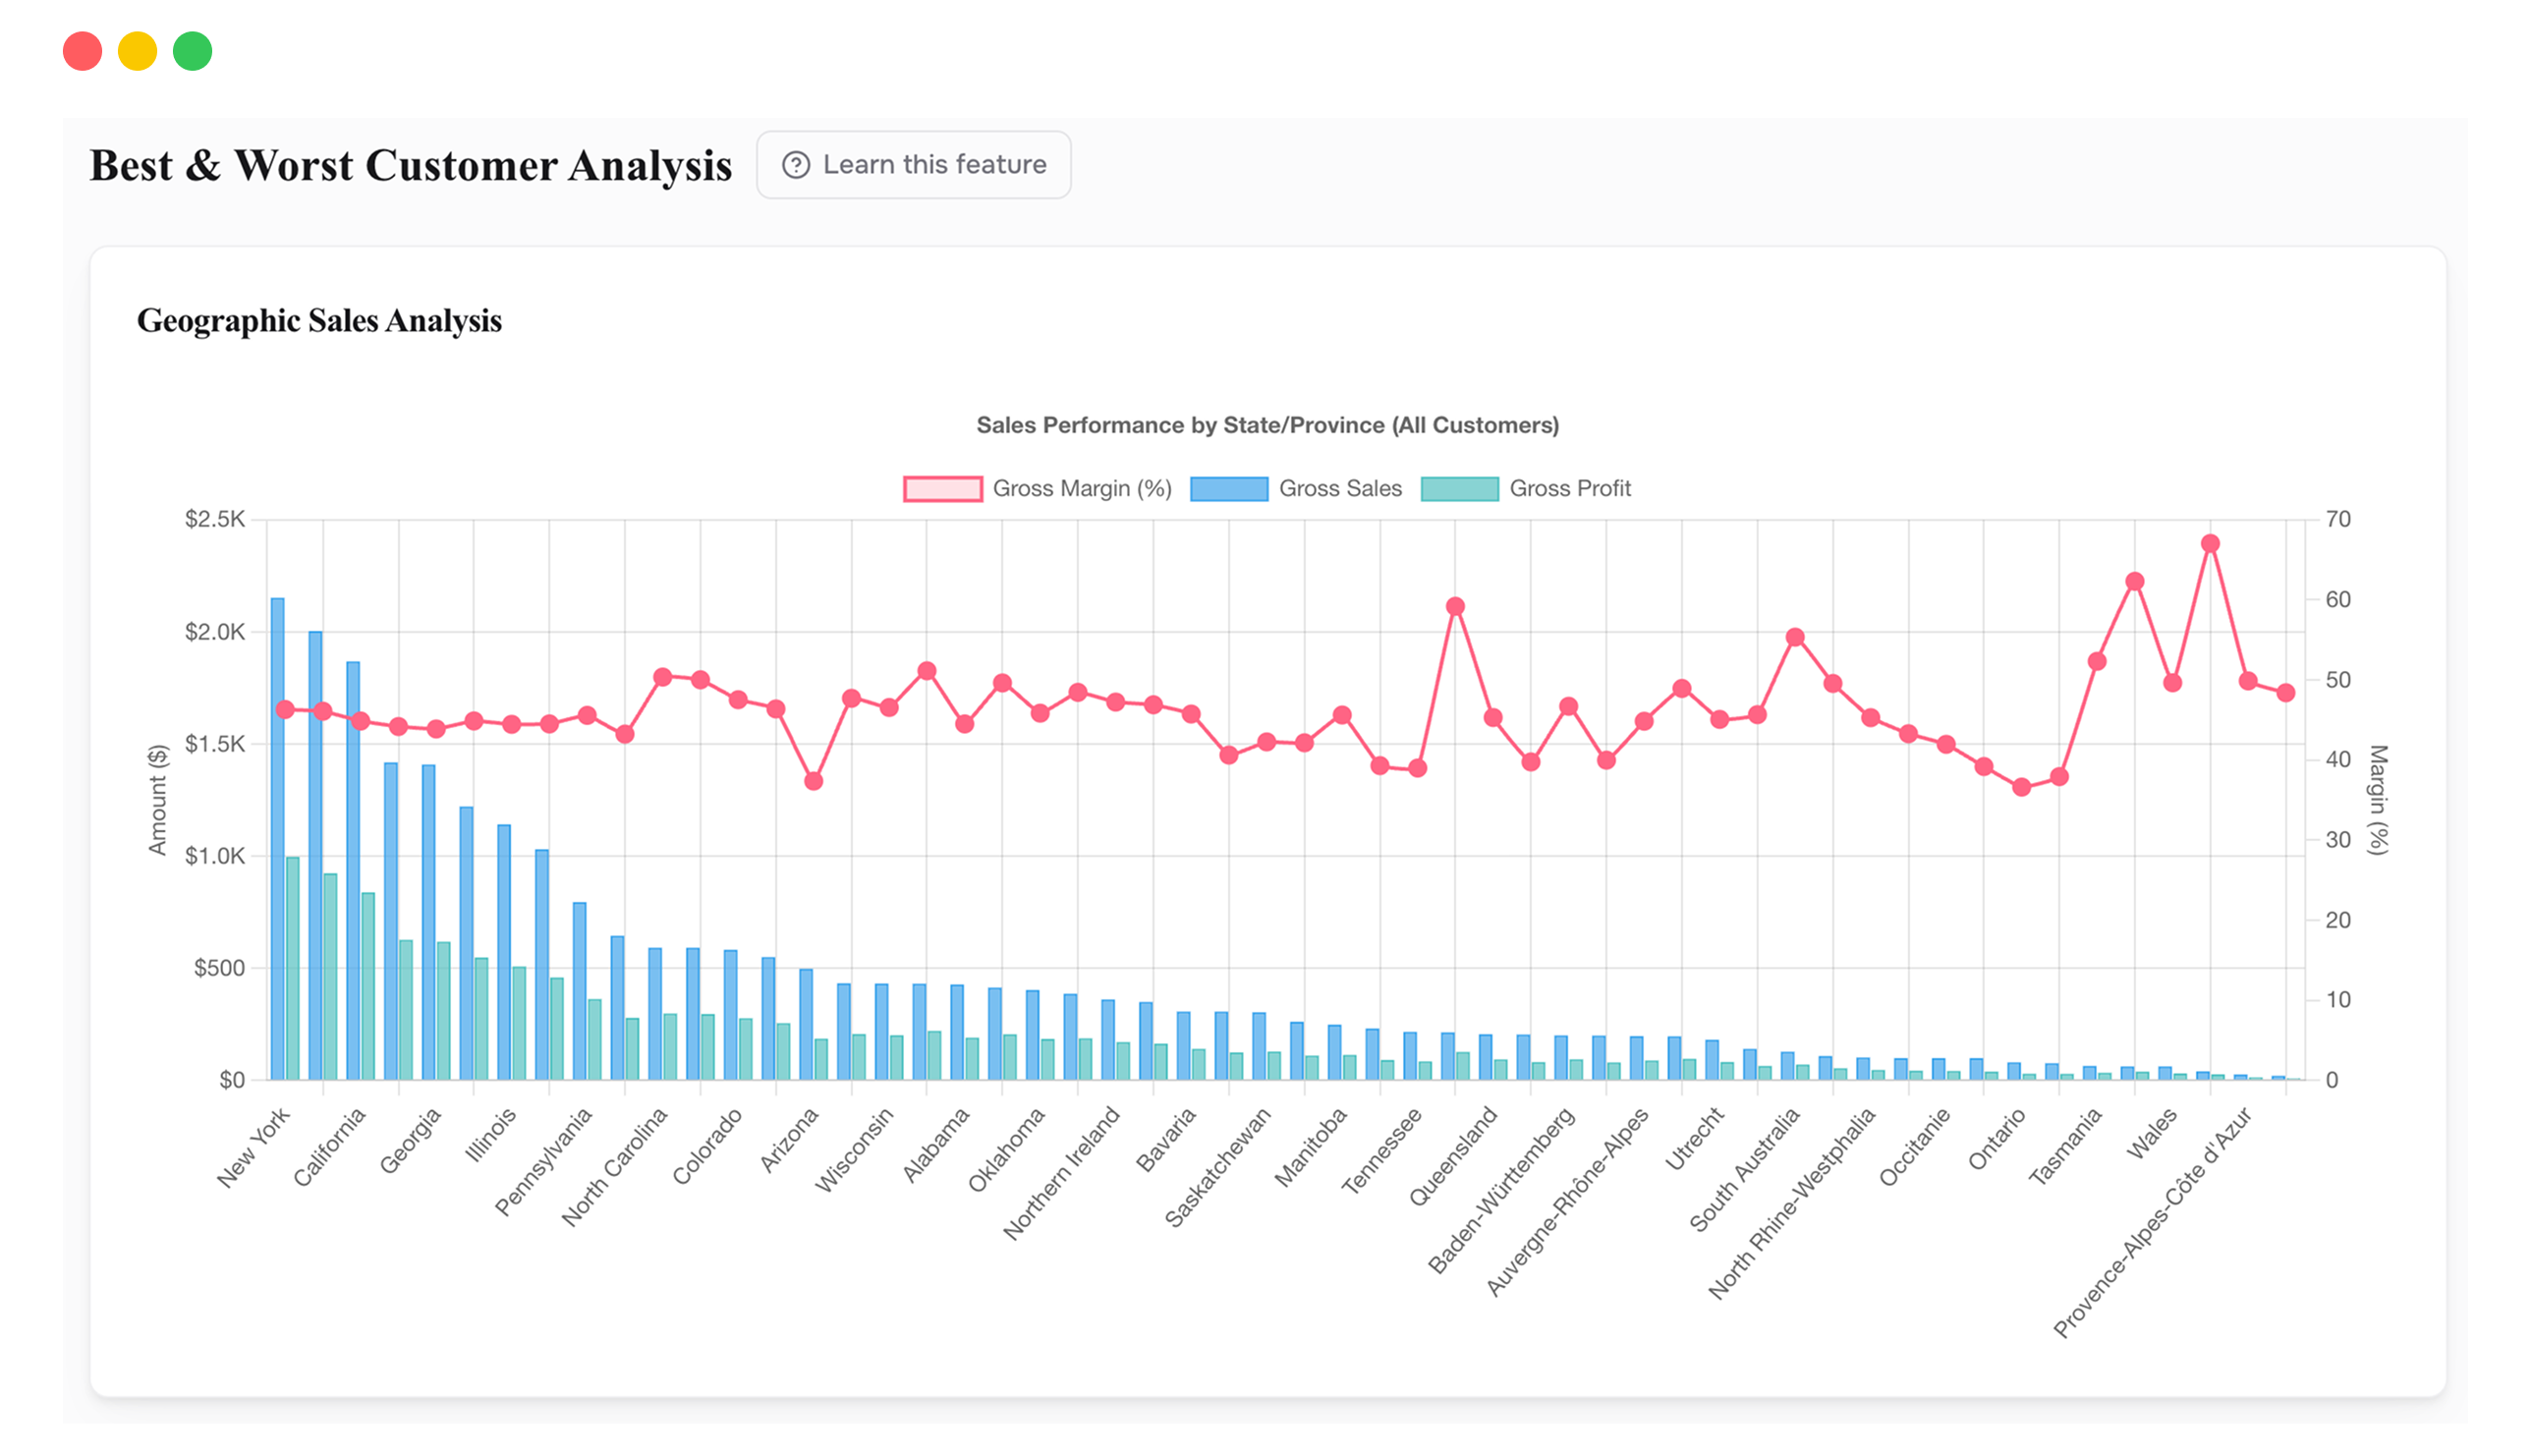
Best & Worst Customers
Your customers split into 10 equal groups ranked by profitability. Most stores discover the top 10% account for 30 to 40% of all profit, while the bottom 10% are often unprofitable. Your retention strategy shouldn't be "keep everyone." It should be "obsess over the top 20% and fix or exit the bottom."
- Customers ranked into 10 profitability deciles.
- Geographic breakdown of your most profitable segments.
- Toggle CAC on to see profit after acquisition cost.
- Identify segments to double down on or stop acquiring.
- Revenue concentration across your entire customer base.
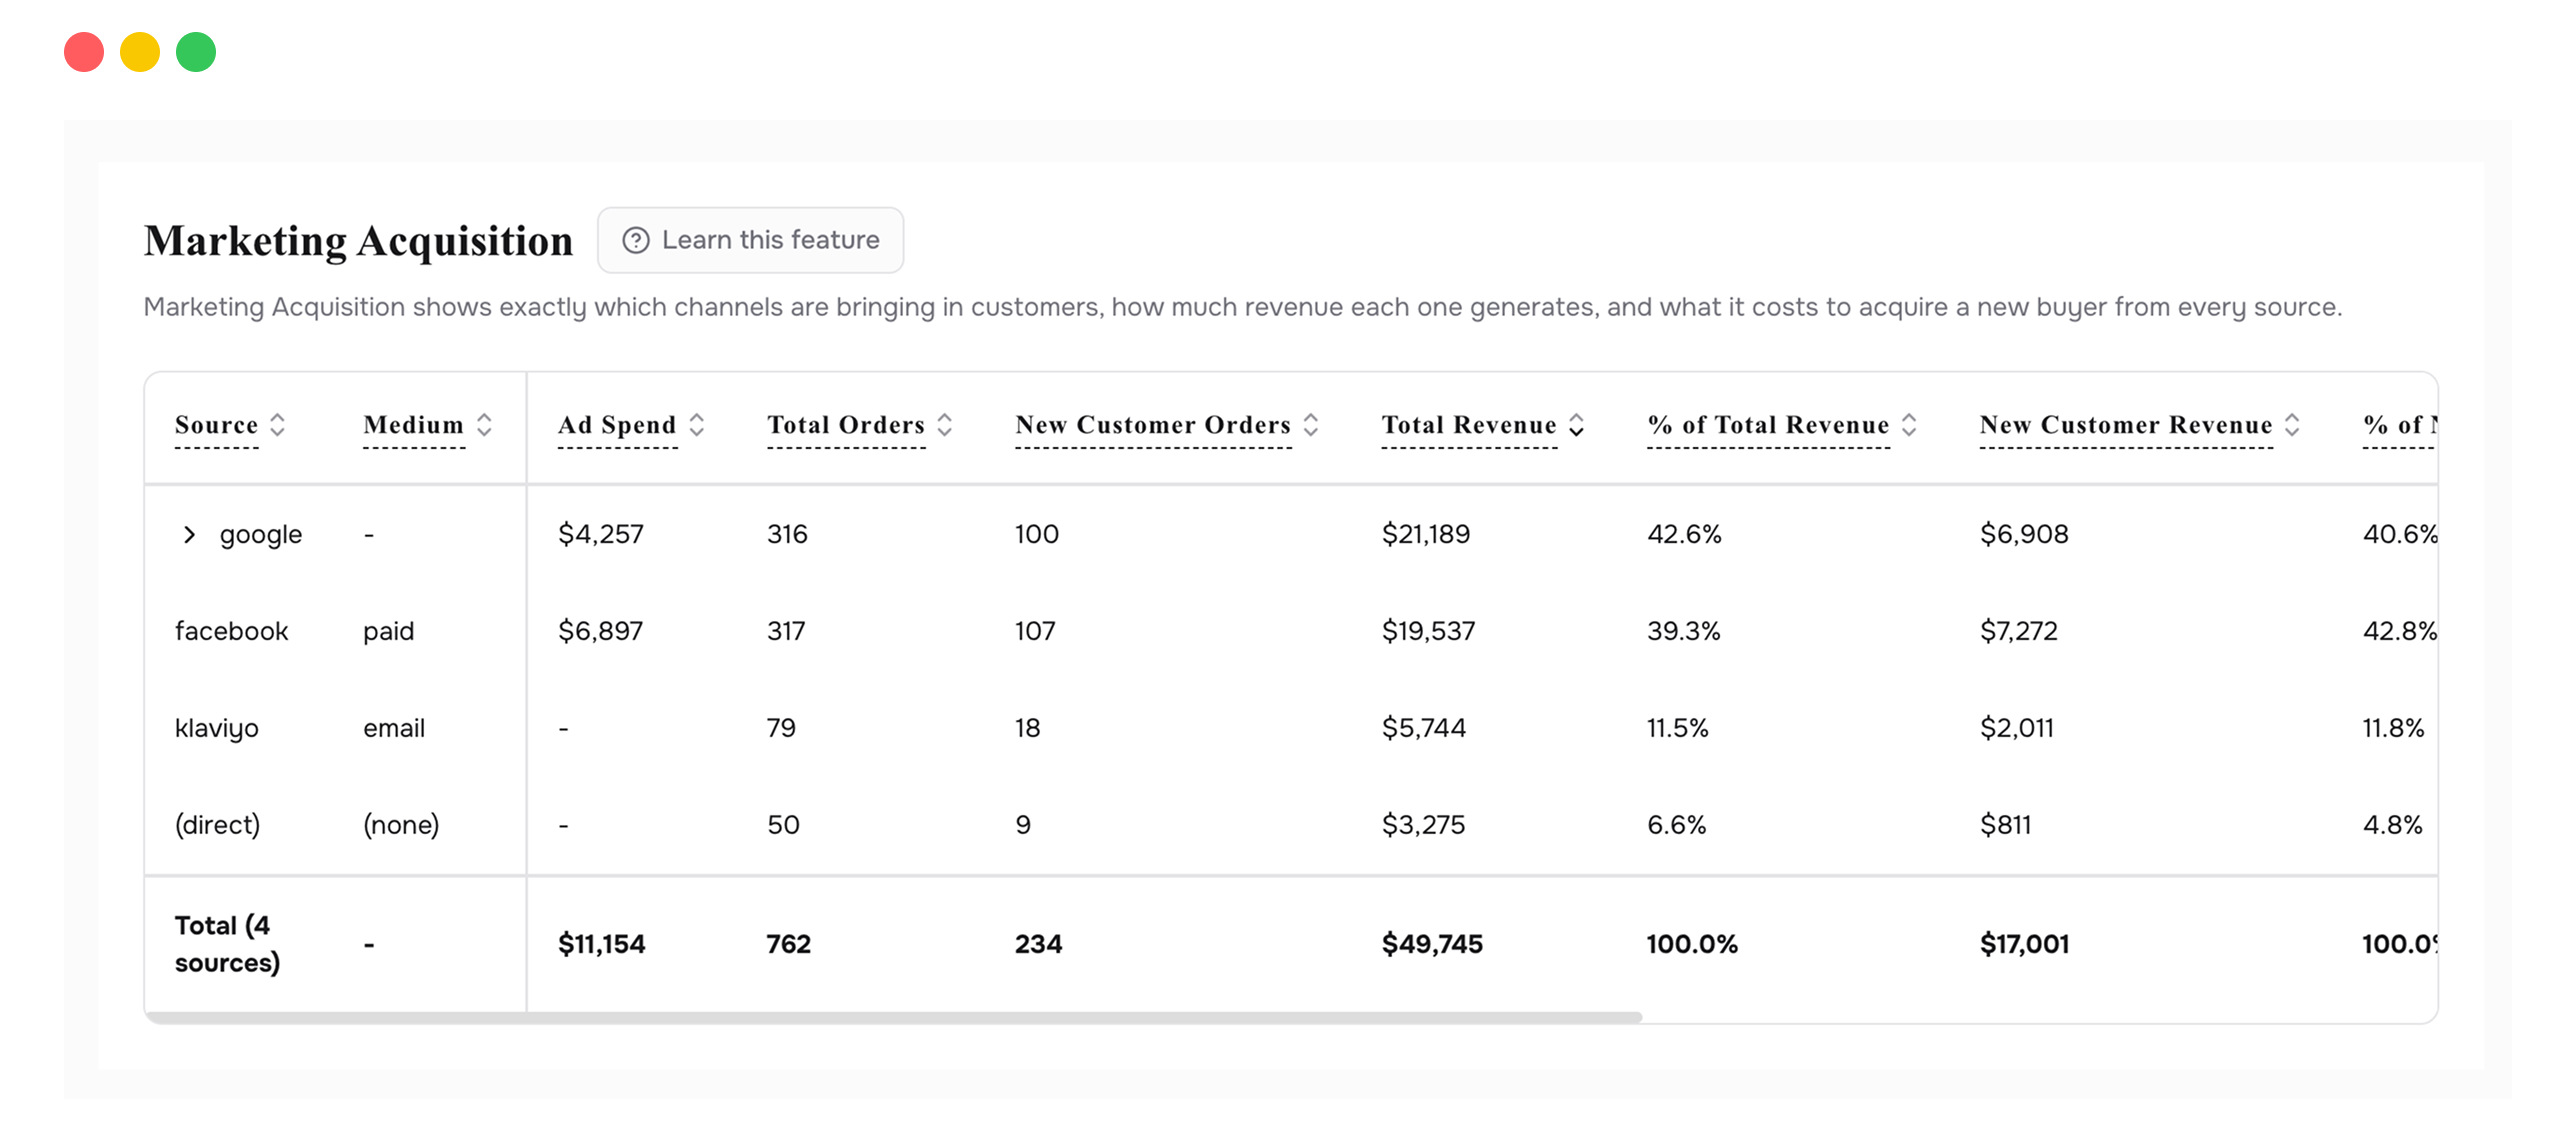
Marketing Acquisition
Every marketing channel broken down by the complete revenue story, not just clicks or impressions. Revenue, cost per acquisition, new vs. repeat customer split, and ROAS. If one channel costs $50 per customer and another costs $30, but the first channel's customers spend twice as much, this table shows you that.
- Total revenue and CPA by channel, not just traffic.
- New customer vs. repeat customer attribution per channel.
- Expand any channel to see sub-source breakdown.
- Sort by any metric to find your most profitable channel.
- Separate acquisition channels from repeat-purchase channels.
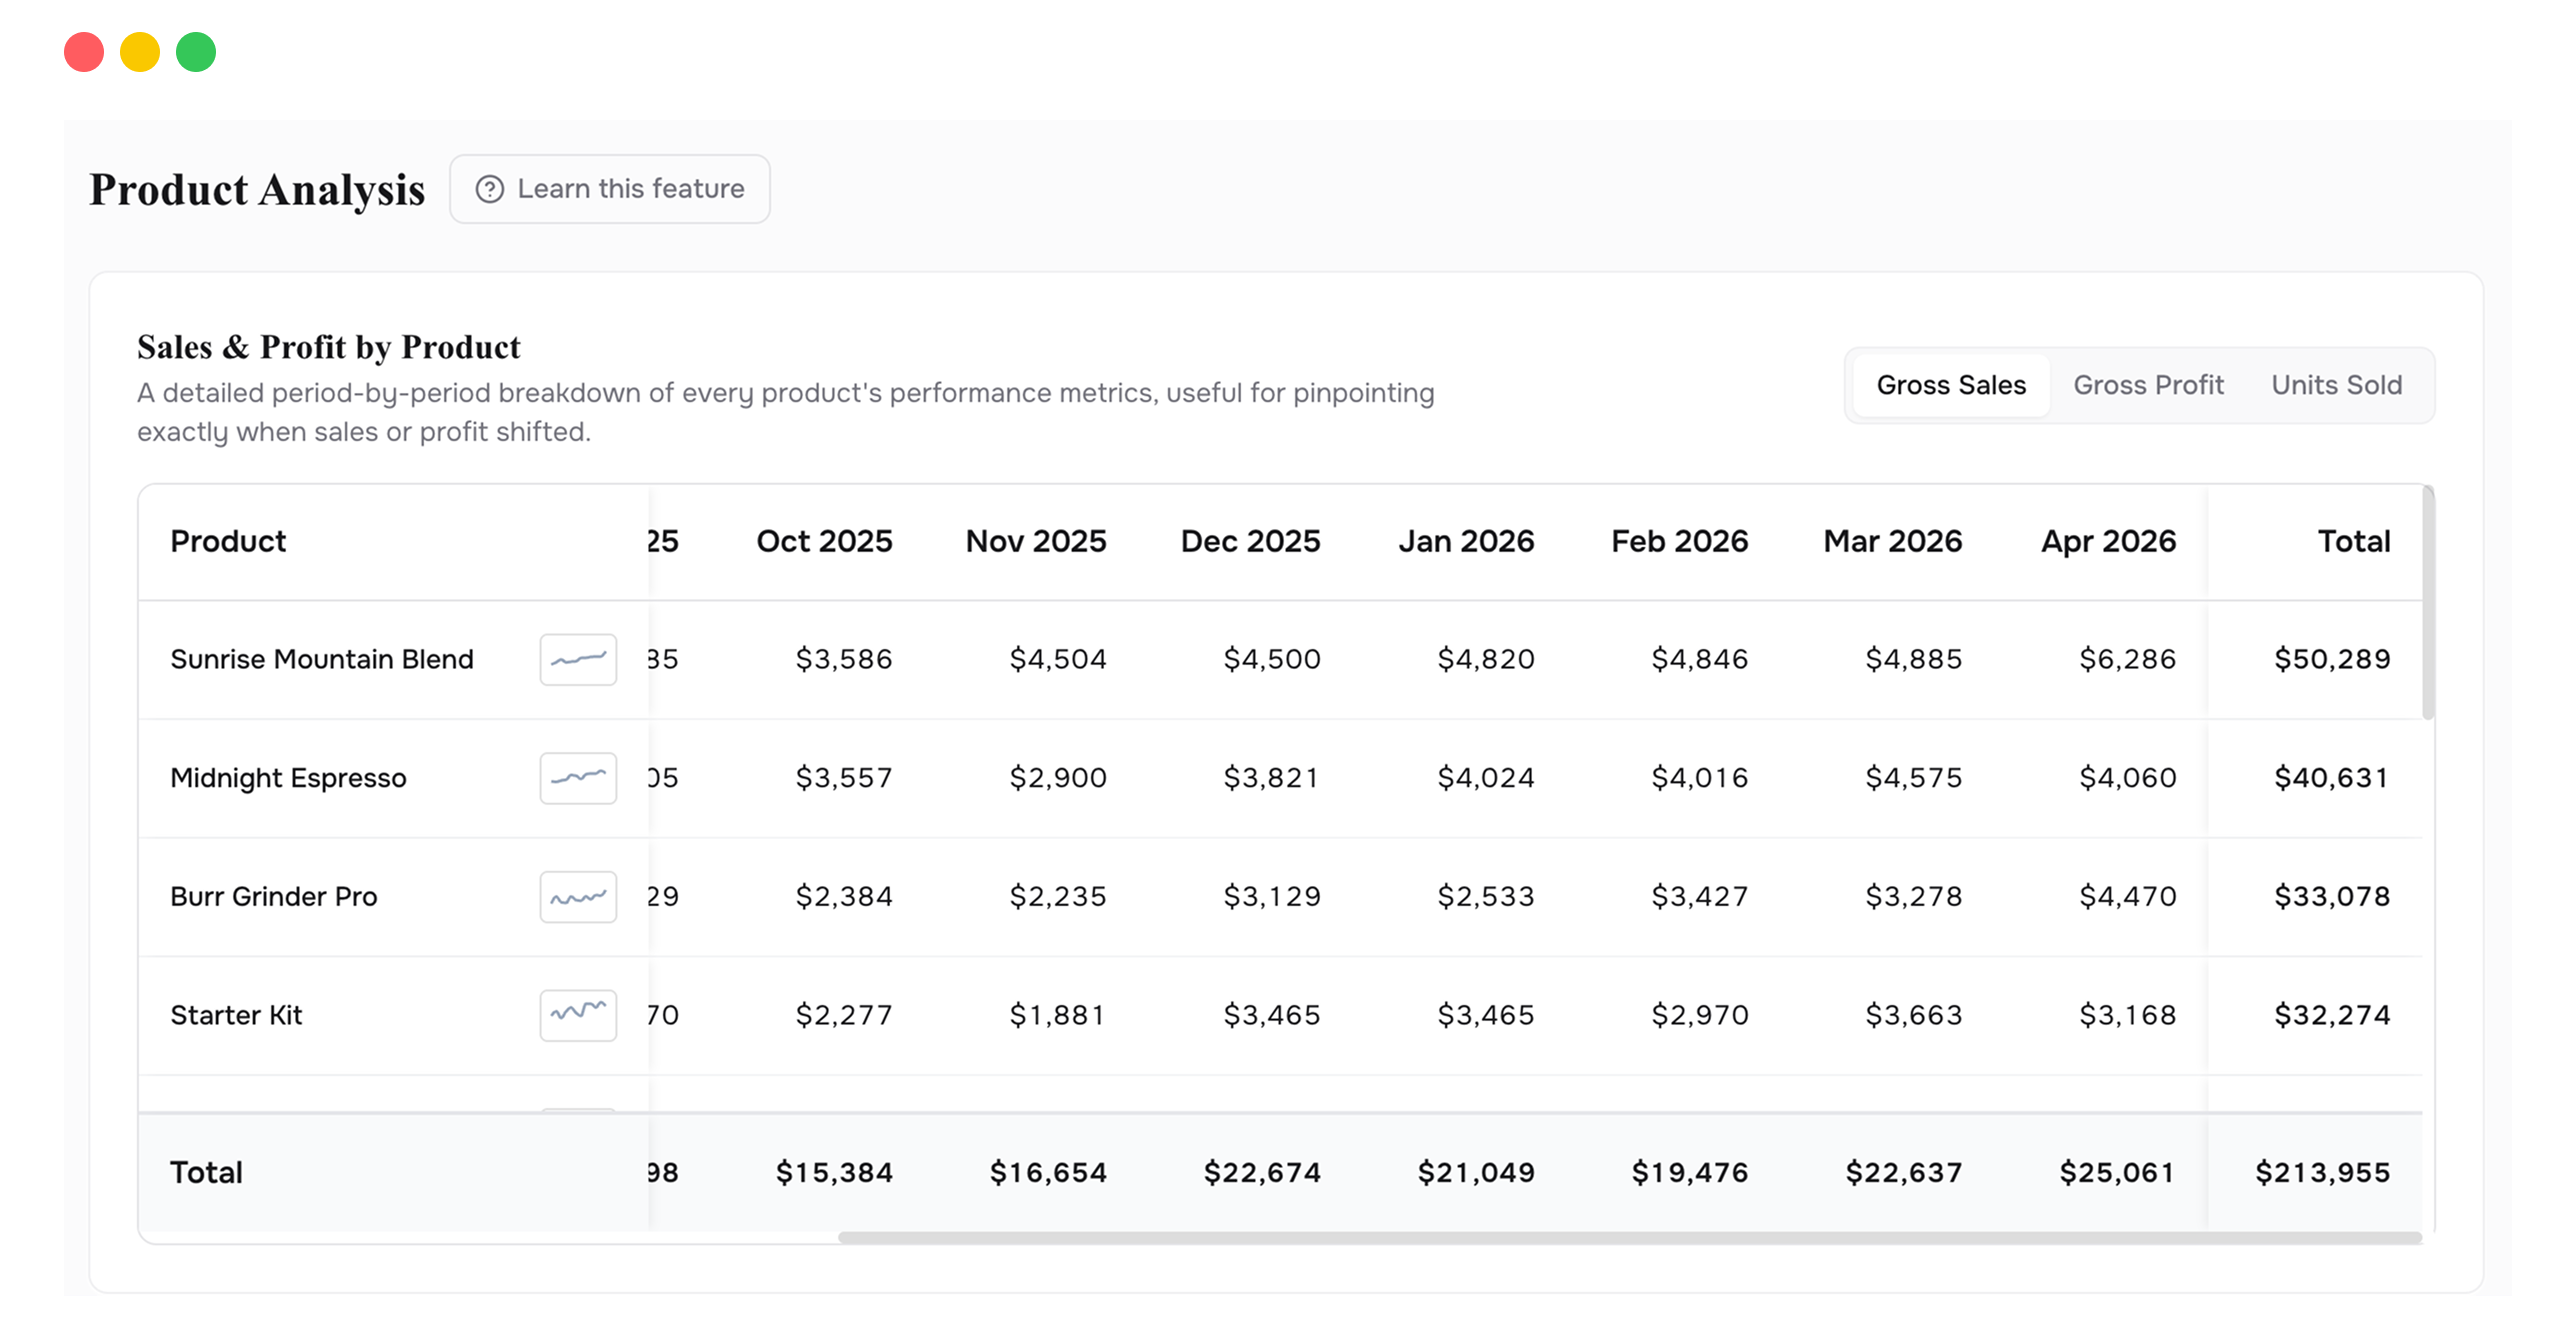
Product Analysis
Gross sales and gross profit trends side by side, by product, variant, or collection, across any time range. The chart surfaces which products deserve attention without digging through tables. High sales + low profit stands out immediately. Click into any product and the full cost breakdown opens below.
- Sales and profit charts, side by side over time.
- Switch between product, variant, and collection views.
- Click any product for the full cost-layer breakdown.
- Top 5 products surfaced automatically, or pick your own.
- Daily, weekly, or monthly time resolution.
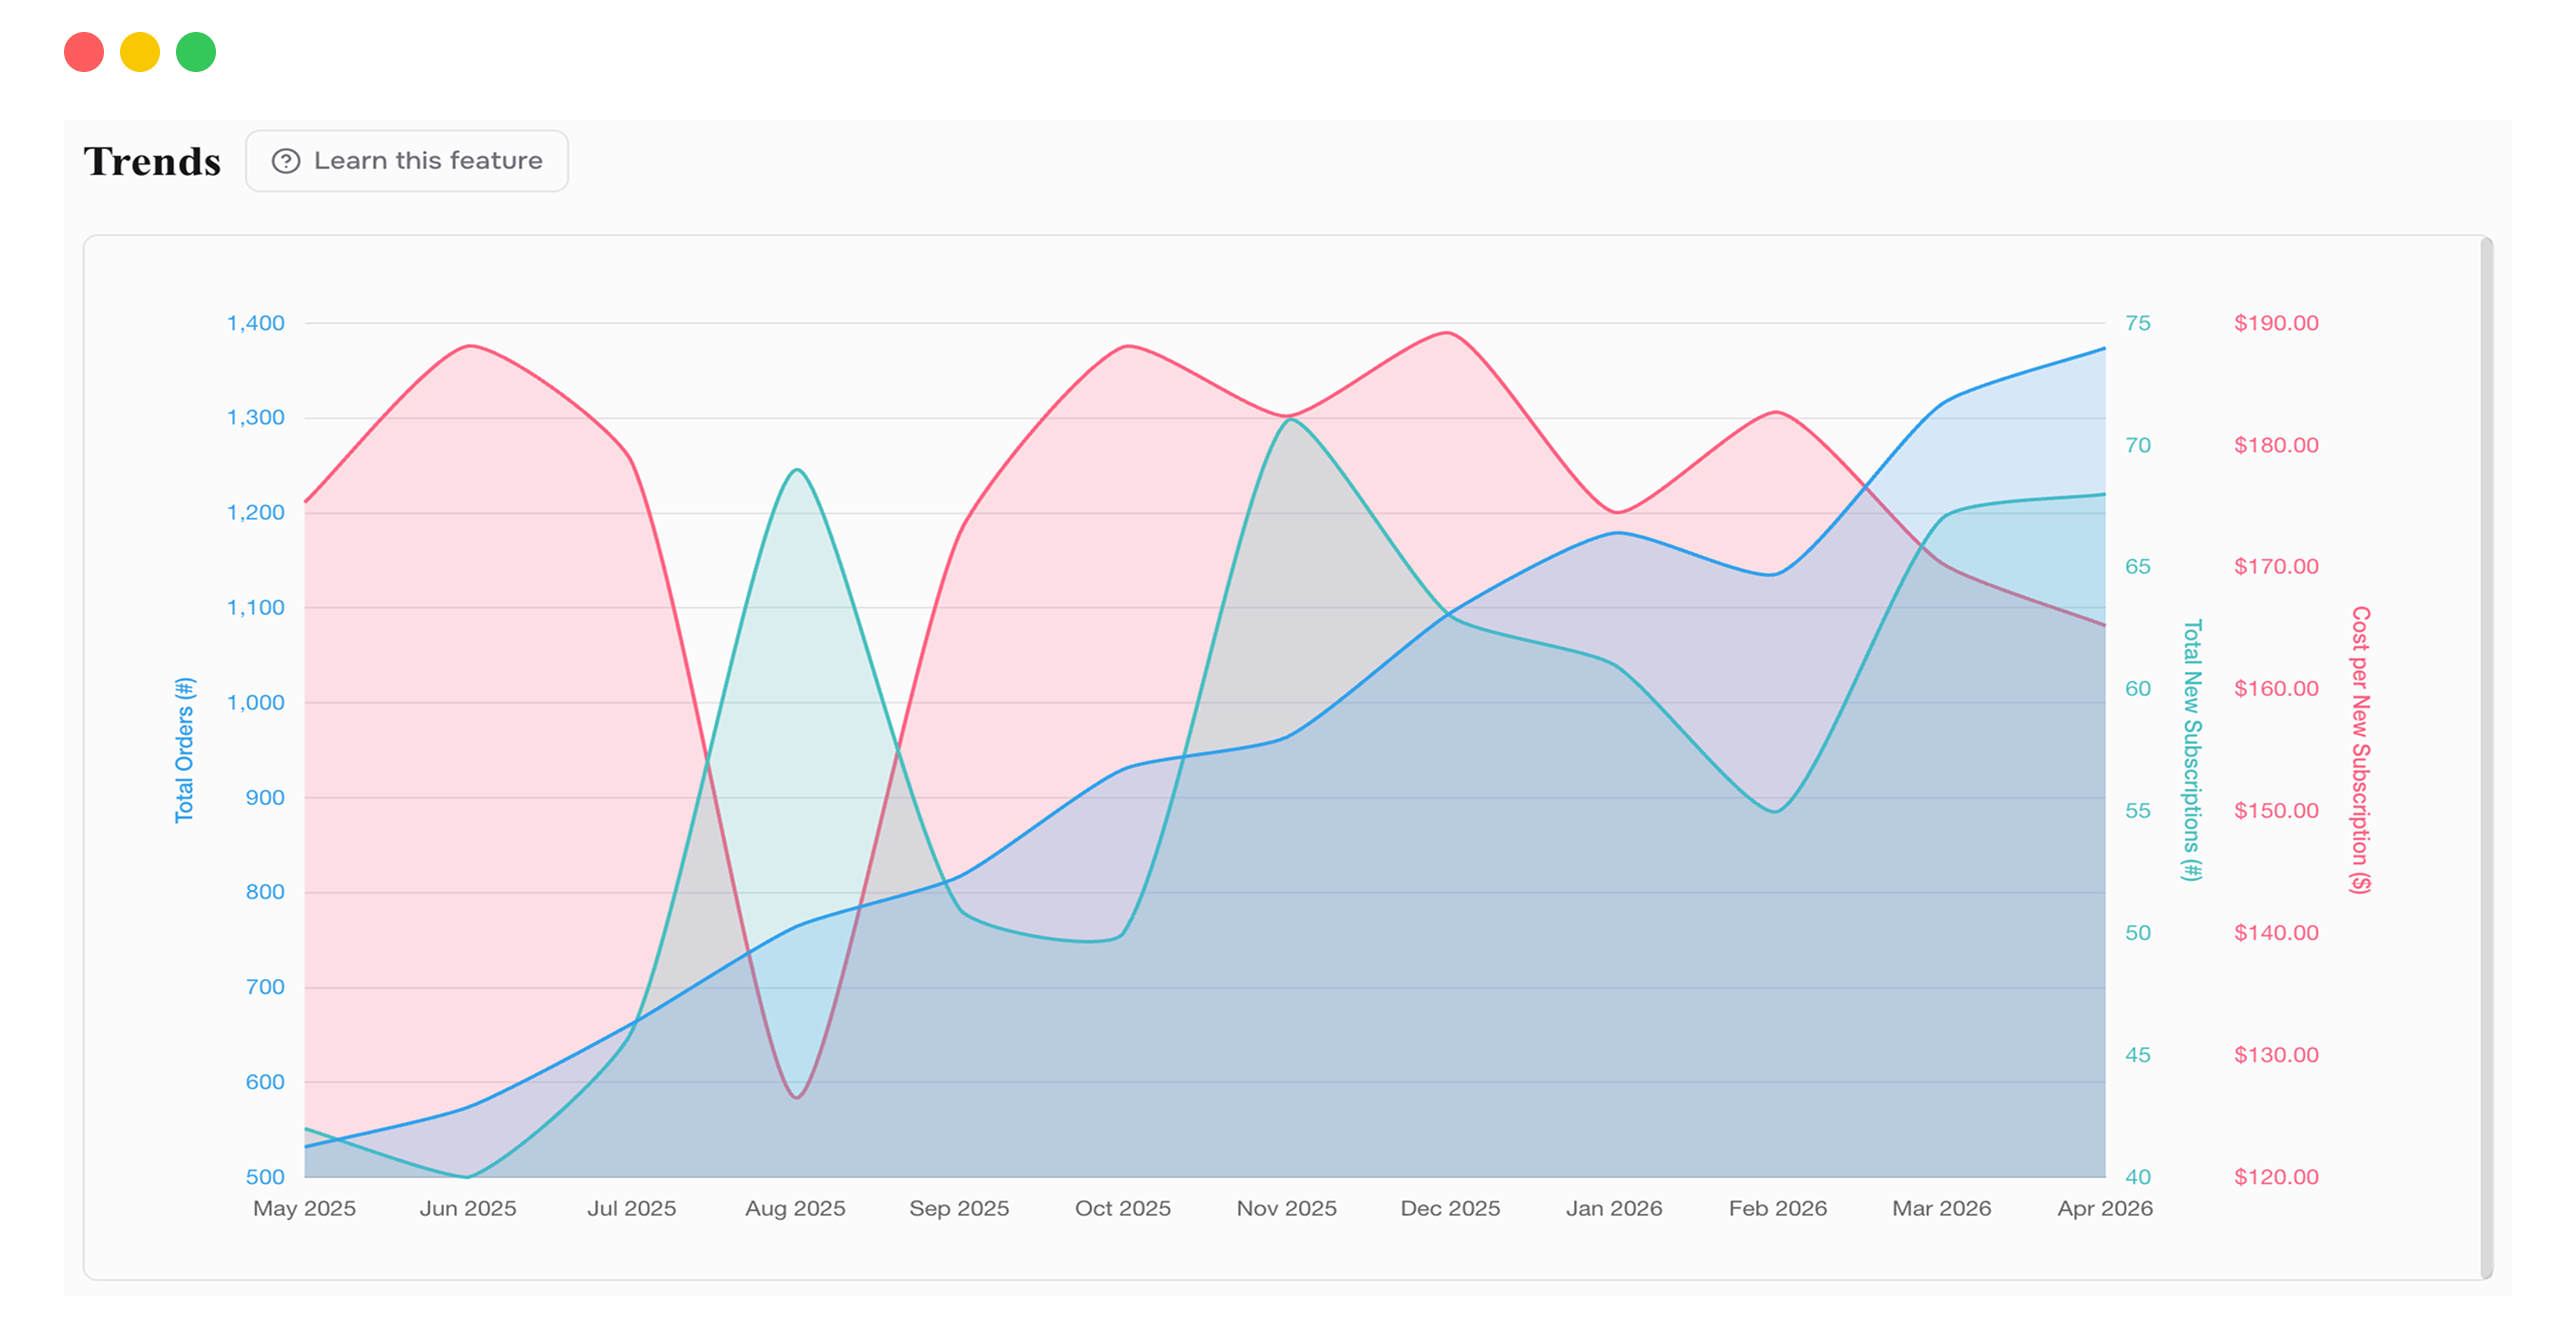
Trends
Overlay up to 3 metrics on one chart and watch how they move together over time. Pre-built presets surface the relationships most brands care about. The useful findings live in divergence: one metric rising while another falls or stays flat. That's the question worth asking.
- Plot any 3 business metrics on one chart simultaneously.
- Pre-built presets for the most common combinations.
- Spot divergence between metrics that should correlate.
- Swap metrics in and out to build the full picture.
- Daily, weekly, or monthly time grouping.

Traffic Source Analysis
Which traffic sources send purchase-ready visitors, not just the most visitors. Sessions, conversions, and conversion rate by source and channel, with trends over time. Some sources drive volume. Others drive buyers. This view shows you which is which, so you know where your next dollar should go.
- Conversion rate by source, not just session volume.
- Sessions, purchases, and revenue over time per source.
- Group by source or by channel for different lenses.
- Top 5 sources highlighted, or pick your own to compare.
- Powered by your Google Analytics 4 data.
Ready to See Your Real Numbers?
Start your free trial today. No credit card required.