
Revenue by Channel, Not Clicks
Total revenue and new customer revenue for every acquisition source. The metric that actually matters.
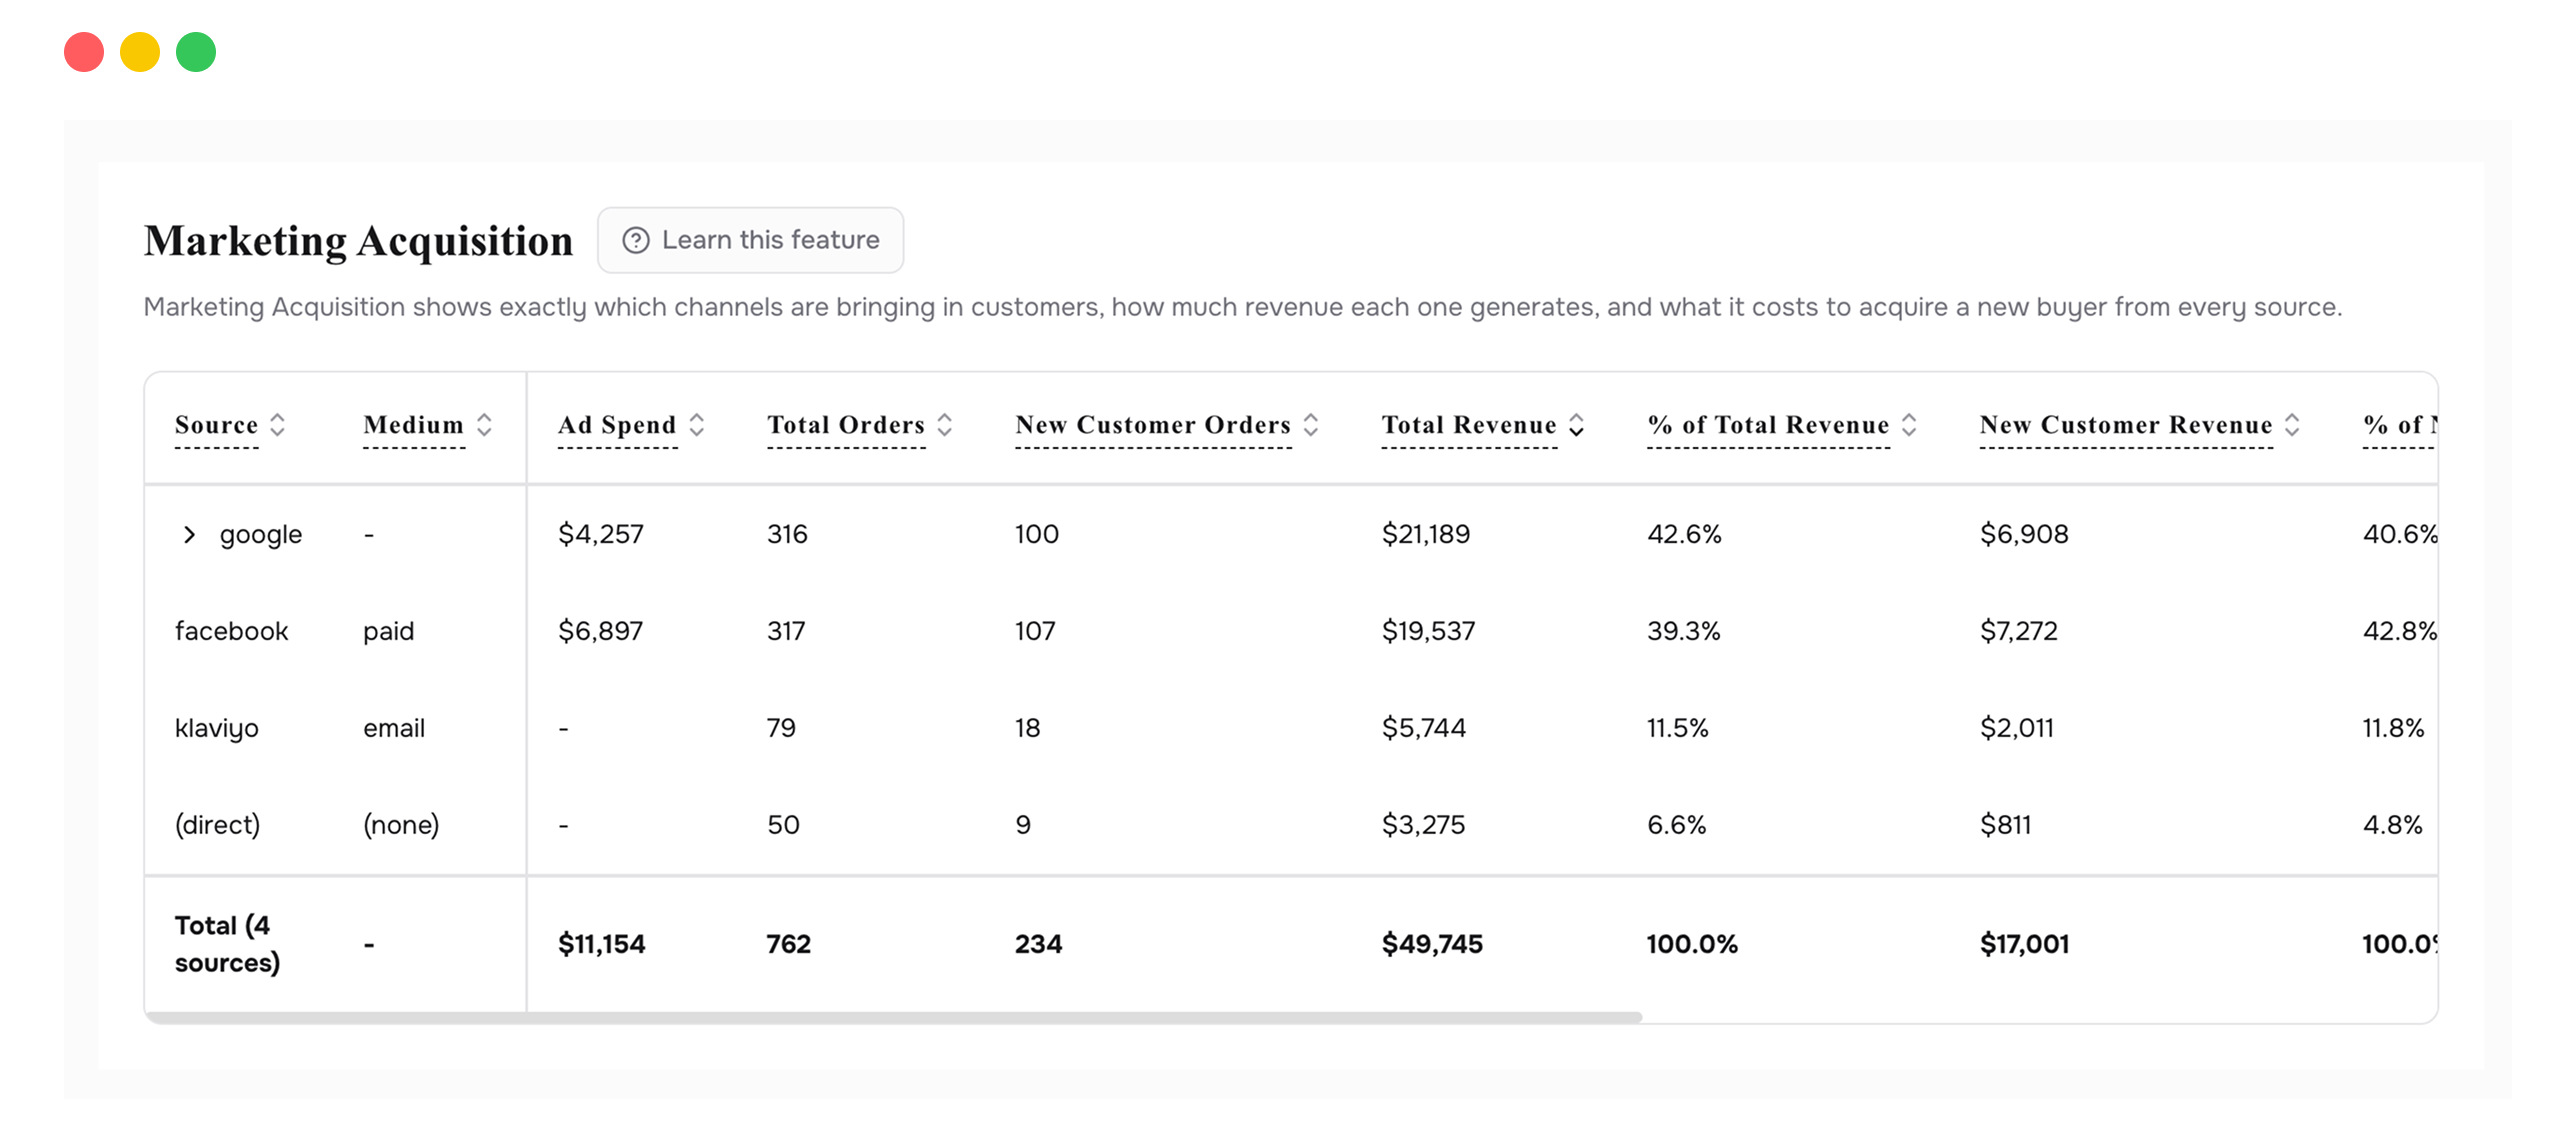
MARKETING ACQUISITION
Every acquisition channel scored by revenue, cost per customer, ROAS, and the split between new and repeat buyers. Not traffic metrics. Profit metrics.
Click-through rates, impressions, and platform-reported ROAS all look healthy. But they don't account for product costs, shipping, refunds, or whether those new customers ever buy again. The gap between what your ad platform tells you and what actually hit your bottom line is where most marketing budgets leak.
Marketing Acquisition shows a single table with every channel that sends you customers: Facebook, Google, email, direct traffic, organic, and everything else. Each row shows total revenue, new customer revenue, average order value, cost per acquisition, new customer CPA, and ROAS. The table sorts by revenue by default, but your most profitable channel might be hiding further down.
Rows are expandable. Click a parent channel to see sub-sources underneath. You can filter by subscription vs. one-time purchases to see which channels drive recurring revenue and which drive one-time transactions. A toggle shows or hides revenue percentage columns so you can see each channel's share of total revenue.
Total revenue and new customer revenue for every acquisition source. The metric that actually matters.
What you pay to bring in each new customer, by channel. The starting point for every budget decision.
Return on ad spend calculated on real revenue data, not platform-estimated conversions.
See which channels bring first-time buyers and which re-engage existing ones. Run different strategies for each.
Click a channel to see its children. "Google" expands to show Search, Shopping, Display. Find the sub-channel that performs.
Separate subscription-first, subscription-recurring, and one-time purchases. See which channels feed recurring revenue.
Open the table and look at Total Revenue, not clicks, not impressions. Then look at Cost Per Acquisition. If Facebook costs you $50 per customer and Google costs $30, but Facebook customers spend twice as much, Facebook might be your winner. The table shows this because revenue and acquisition cost sit in the same row. Your ad platform can't make that comparison for you.
If a channel has high volume but tiny revenue per customer, or costs you $100 to acquire someone who spends $120 once and never returns, pause it. This table gives you the numbers to make that call.
If one channel costs $30 to acquire a customer who generates $200 over their lifetime, that's where your next dollar should go. This table tells you which channel that is.
Some channels are great at getting new customers. Others are better at re-engaging existing ones. The new vs. repeat column shows you which does what, so you can run the right strategy on each.
Expand a channel and you might discover that Google Shopping drives all the value while Google Search breaks even. The parent-level number hides that. The expansion reveals it.
That channel's ad platform probably isn't connected yet. Visit the Integrations page and connect it. Once linked, ad spend data will populate automatically.
Not necessarily. Check what type of customer it brings. A channel with a high CPA but strong repeat purchase rate might be acquiring your most loyal customers. The new vs. repeat split helps you decide.
Revenue divided by ad spend, using your actual Shopify revenue data matched to the channel. It's not the ROAS your ad platform reports, which uses estimated conversions. This is the real number.
Connect your Shopify store in 2 minutes. Your P&L, LTV, unit economics, and forecasts are ready the same day. No credit card required to start.