
Pre-Built Report Templates
Start with templates for the most common analyses. Revenue, margin, retention, and marketing performance reports ready to run.
REPORTS
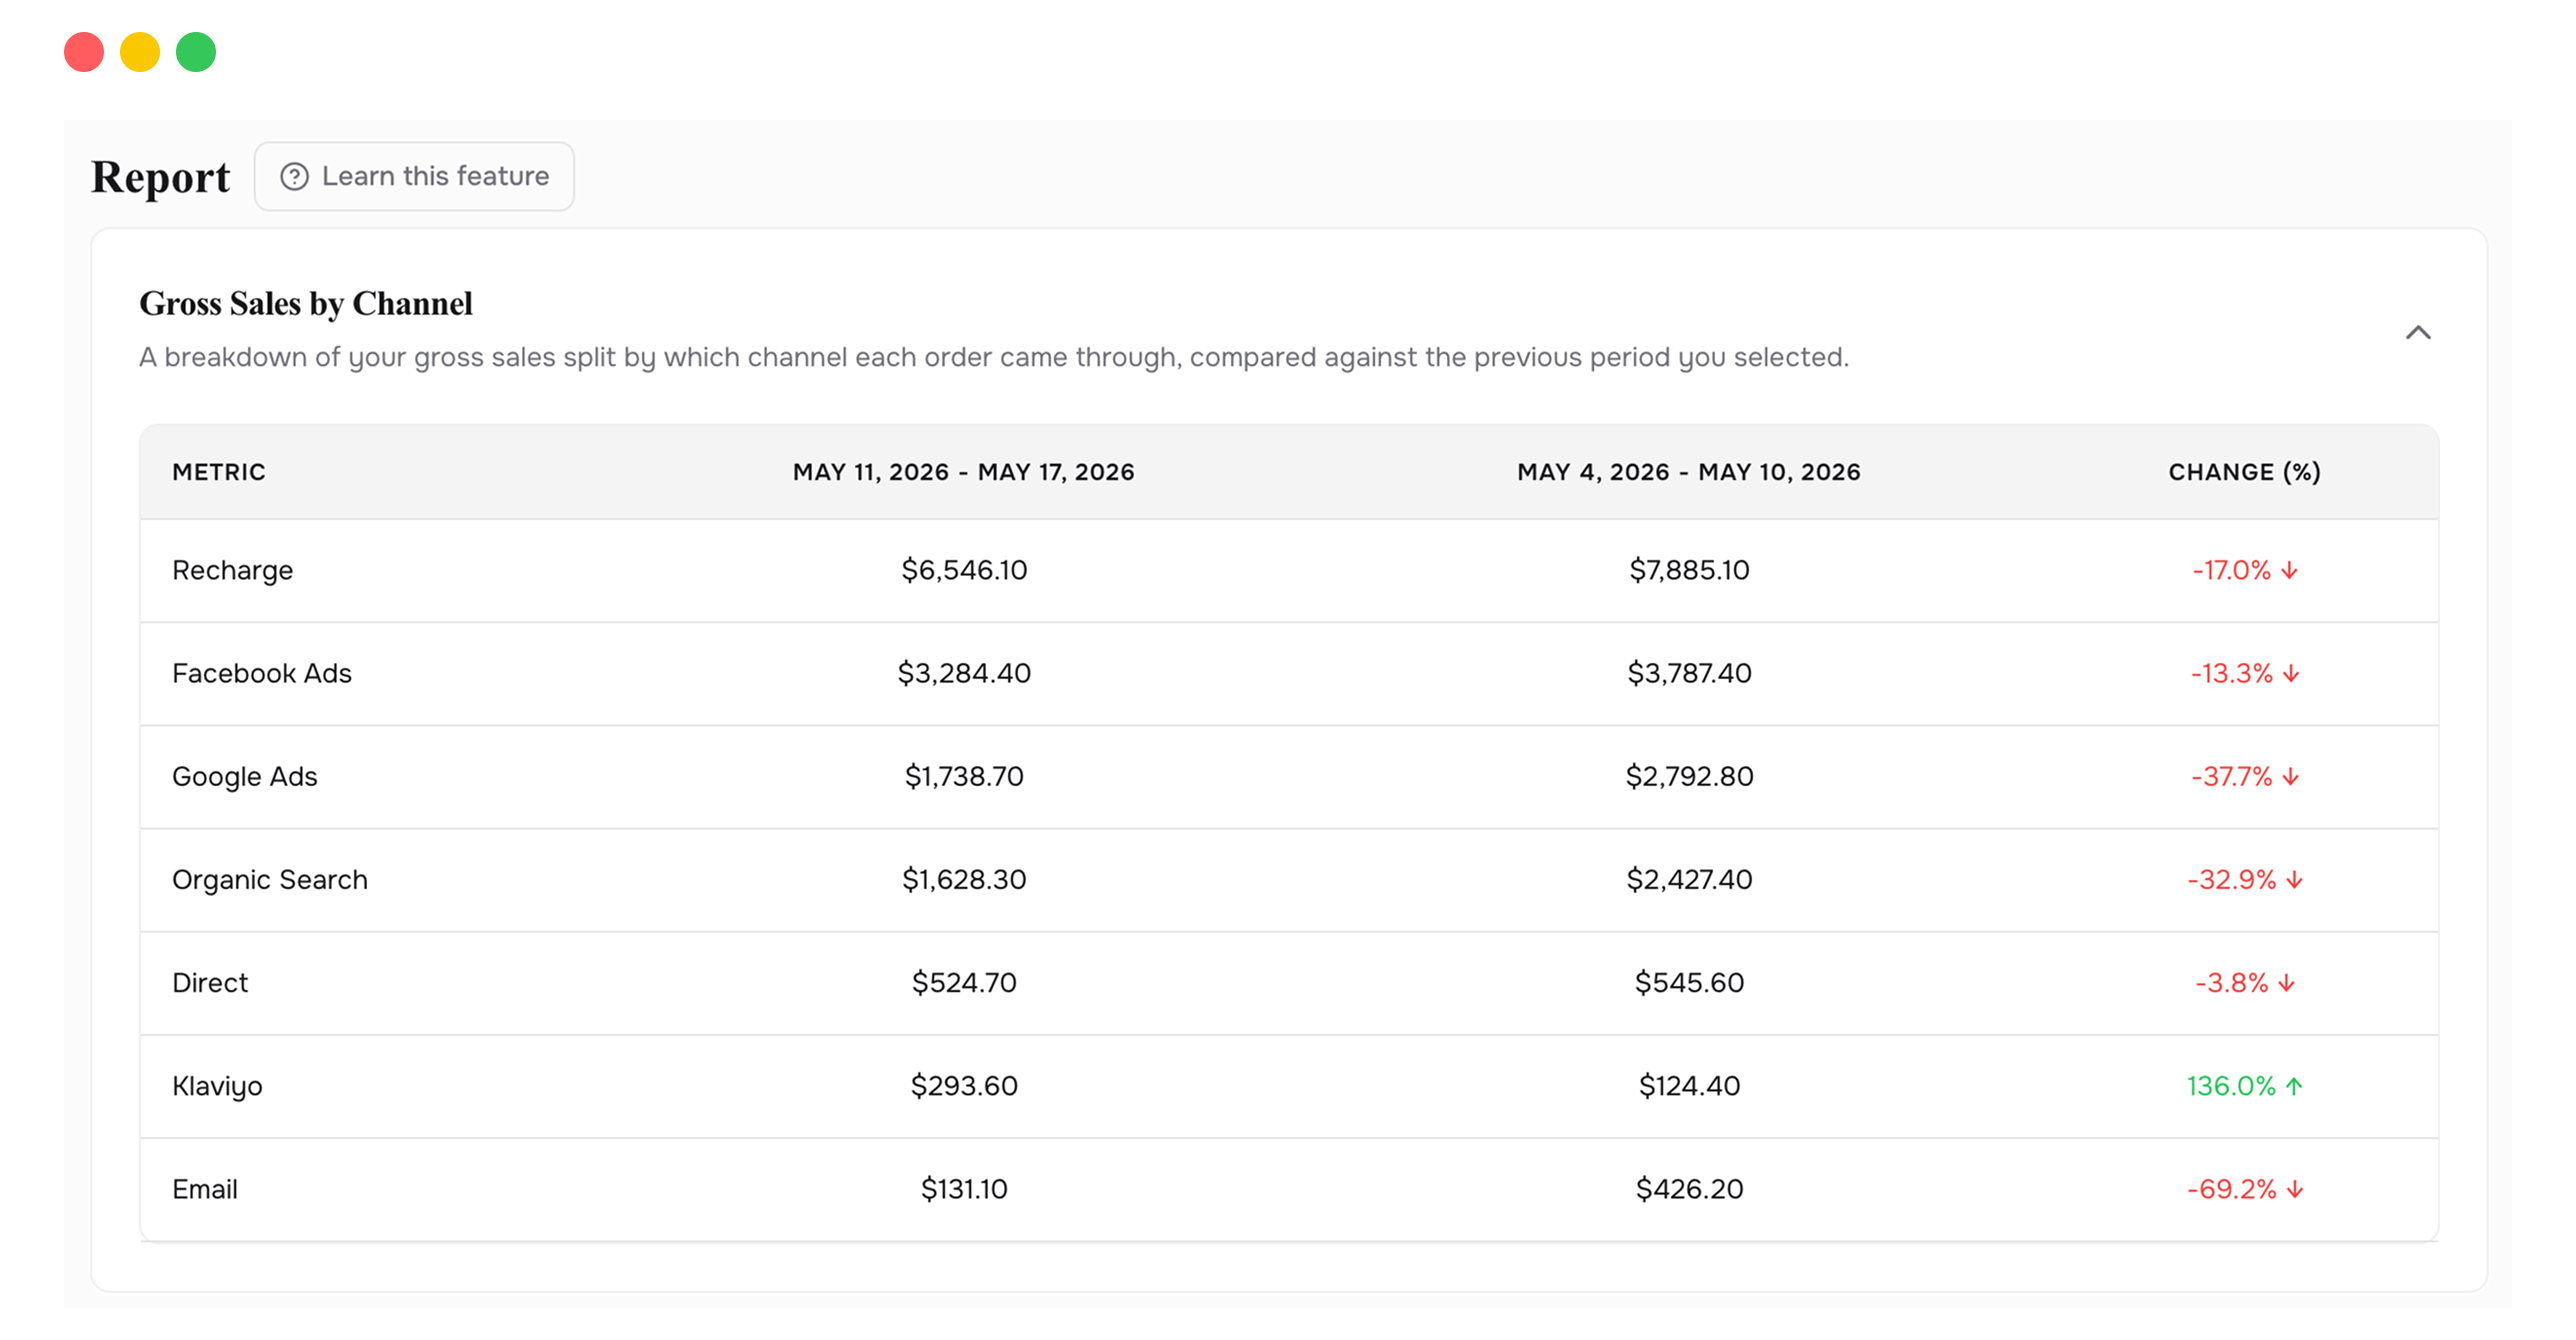
Revenue, margin, retention, and marketing spend in one place. Side-by-side period comparisons with Excel export ready for your team. No more spreadsheet jungle.
Every time someone asks for a number, you open Shopify, cross-reference it with your ad platform, paste it into a sheet, and hope the formulas still work. The report takes hours to build. By the time it's done, the data is already stale. And next month, you do it all over again.
Reports gives you a single engine for every recurring analysis. Pre-built templates cover the reports most brands run weekly or monthly: revenue breakdown, margin analysis, retention metrics, and marketing performance. Each report pulls from your connected data sources automatically, so the numbers are always current.
Side-by-side period comparison lets you place any two date ranges next to each other — this month vs. last month, this quarter vs. the same quarter last year, or any custom range. Every report exports to Excel with one click, formatted and ready to share with your team or accountant. No more copy-paste, no more broken formulas.
Start with templates for the most common analyses. Revenue, margin, retention, and marketing performance reports ready to run.
Compare any two date ranges. This month vs. last month, this quarter vs. same quarter last year, or any custom range.
Every report exports to a formatted Excel file. Ready for your team, your board, or your accountant.
All the metrics that matter in one view. No more stitching together numbers from multiple tools.
Slice any report by product line, acquisition channel, or customer segment to answer specific questions.
Reports pull from your connected integrations in real time. The numbers are always current without manual data entry.
The real value of a reporting engine isn't the report itself — it's the time you get back. If your weekly report takes 3 hours to build manually, that's 150+ hours a year spent assembling data instead of acting on it. When the report builds itself, you spend that time on decisions, not data entry.
Set up your key reports once. Each month, open them, compare periods, and export. What used to take hours now takes minutes.
When everyone pulls from the same reporting engine, there's one version of the truth. No more conflicting spreadsheets or debates about whose numbers are right.
"What was our margin last Q3?" Open the margin report, set the date range, and you have the answer. No digging through old spreadsheets.
The Excel export is formatted and labeled. Hand it to your accountant or drop it into a board deck without reformatting.
Start with the pre-built templates and filter by product, channel, or segment. The templates cover the most common analyses. Custom metric selection is on the roadmap.
The P&L Statement is one specific report focused on profit and loss. Reports is the broader engine that includes P&L alongside revenue breakdowns, retention metrics, marketing performance, and more. Think of P&L as one report inside the reporting engine.
The export includes formatted data tables with all the numbers from the on-screen report. Charts are displayed in the app; the export focuses on the underlying data for further analysis.
Connect your Shopify store in 2 minutes. Your P&L, LTV, unit economics, and forecasts are ready the same day. No credit card required to start.