
Every Cost Layer, Itemized
COGS, shipping, handling, transaction fees, marketing, discounts, and refunds. Nothing estimated. Nothing hidden.
PROFIT & LOSS STATEMENT
A complete financial breakdown from gross sales through COGS, shipping, handling, fees, and marketing, down to the net profit number that actually matters. Not revenue. Profit.
Most Shopify brands expect 30% or higher margins. When you run the real math, accounting for every cost layer, the number is usually 5 to 15%. That's not bad news. It's the first honest number you've had. And once you see where the gap is, you know exactly what to fix.
The P&L Statement breaks your business into a line-by-line financial table. Gross sales at the top, then every cost that eats into it: product costs, fulfillment, shipping, handling, transaction fees, marketing spend, discounts, and refunds. At the bottom, your actual net profit. Each line item is broken into time periods with sparkline trend charts, so you can see not just the number but the direction it's moving.
You can toggle the entire view between dollars and percentages. Dollar amounts are useful for budgeting. Percentages are useful for finding the levers that actually matter. A $500 shipping reduction sounds meaningful until you see it's 0.1% of revenue. Percentage view makes the real opportunities impossible to miss.
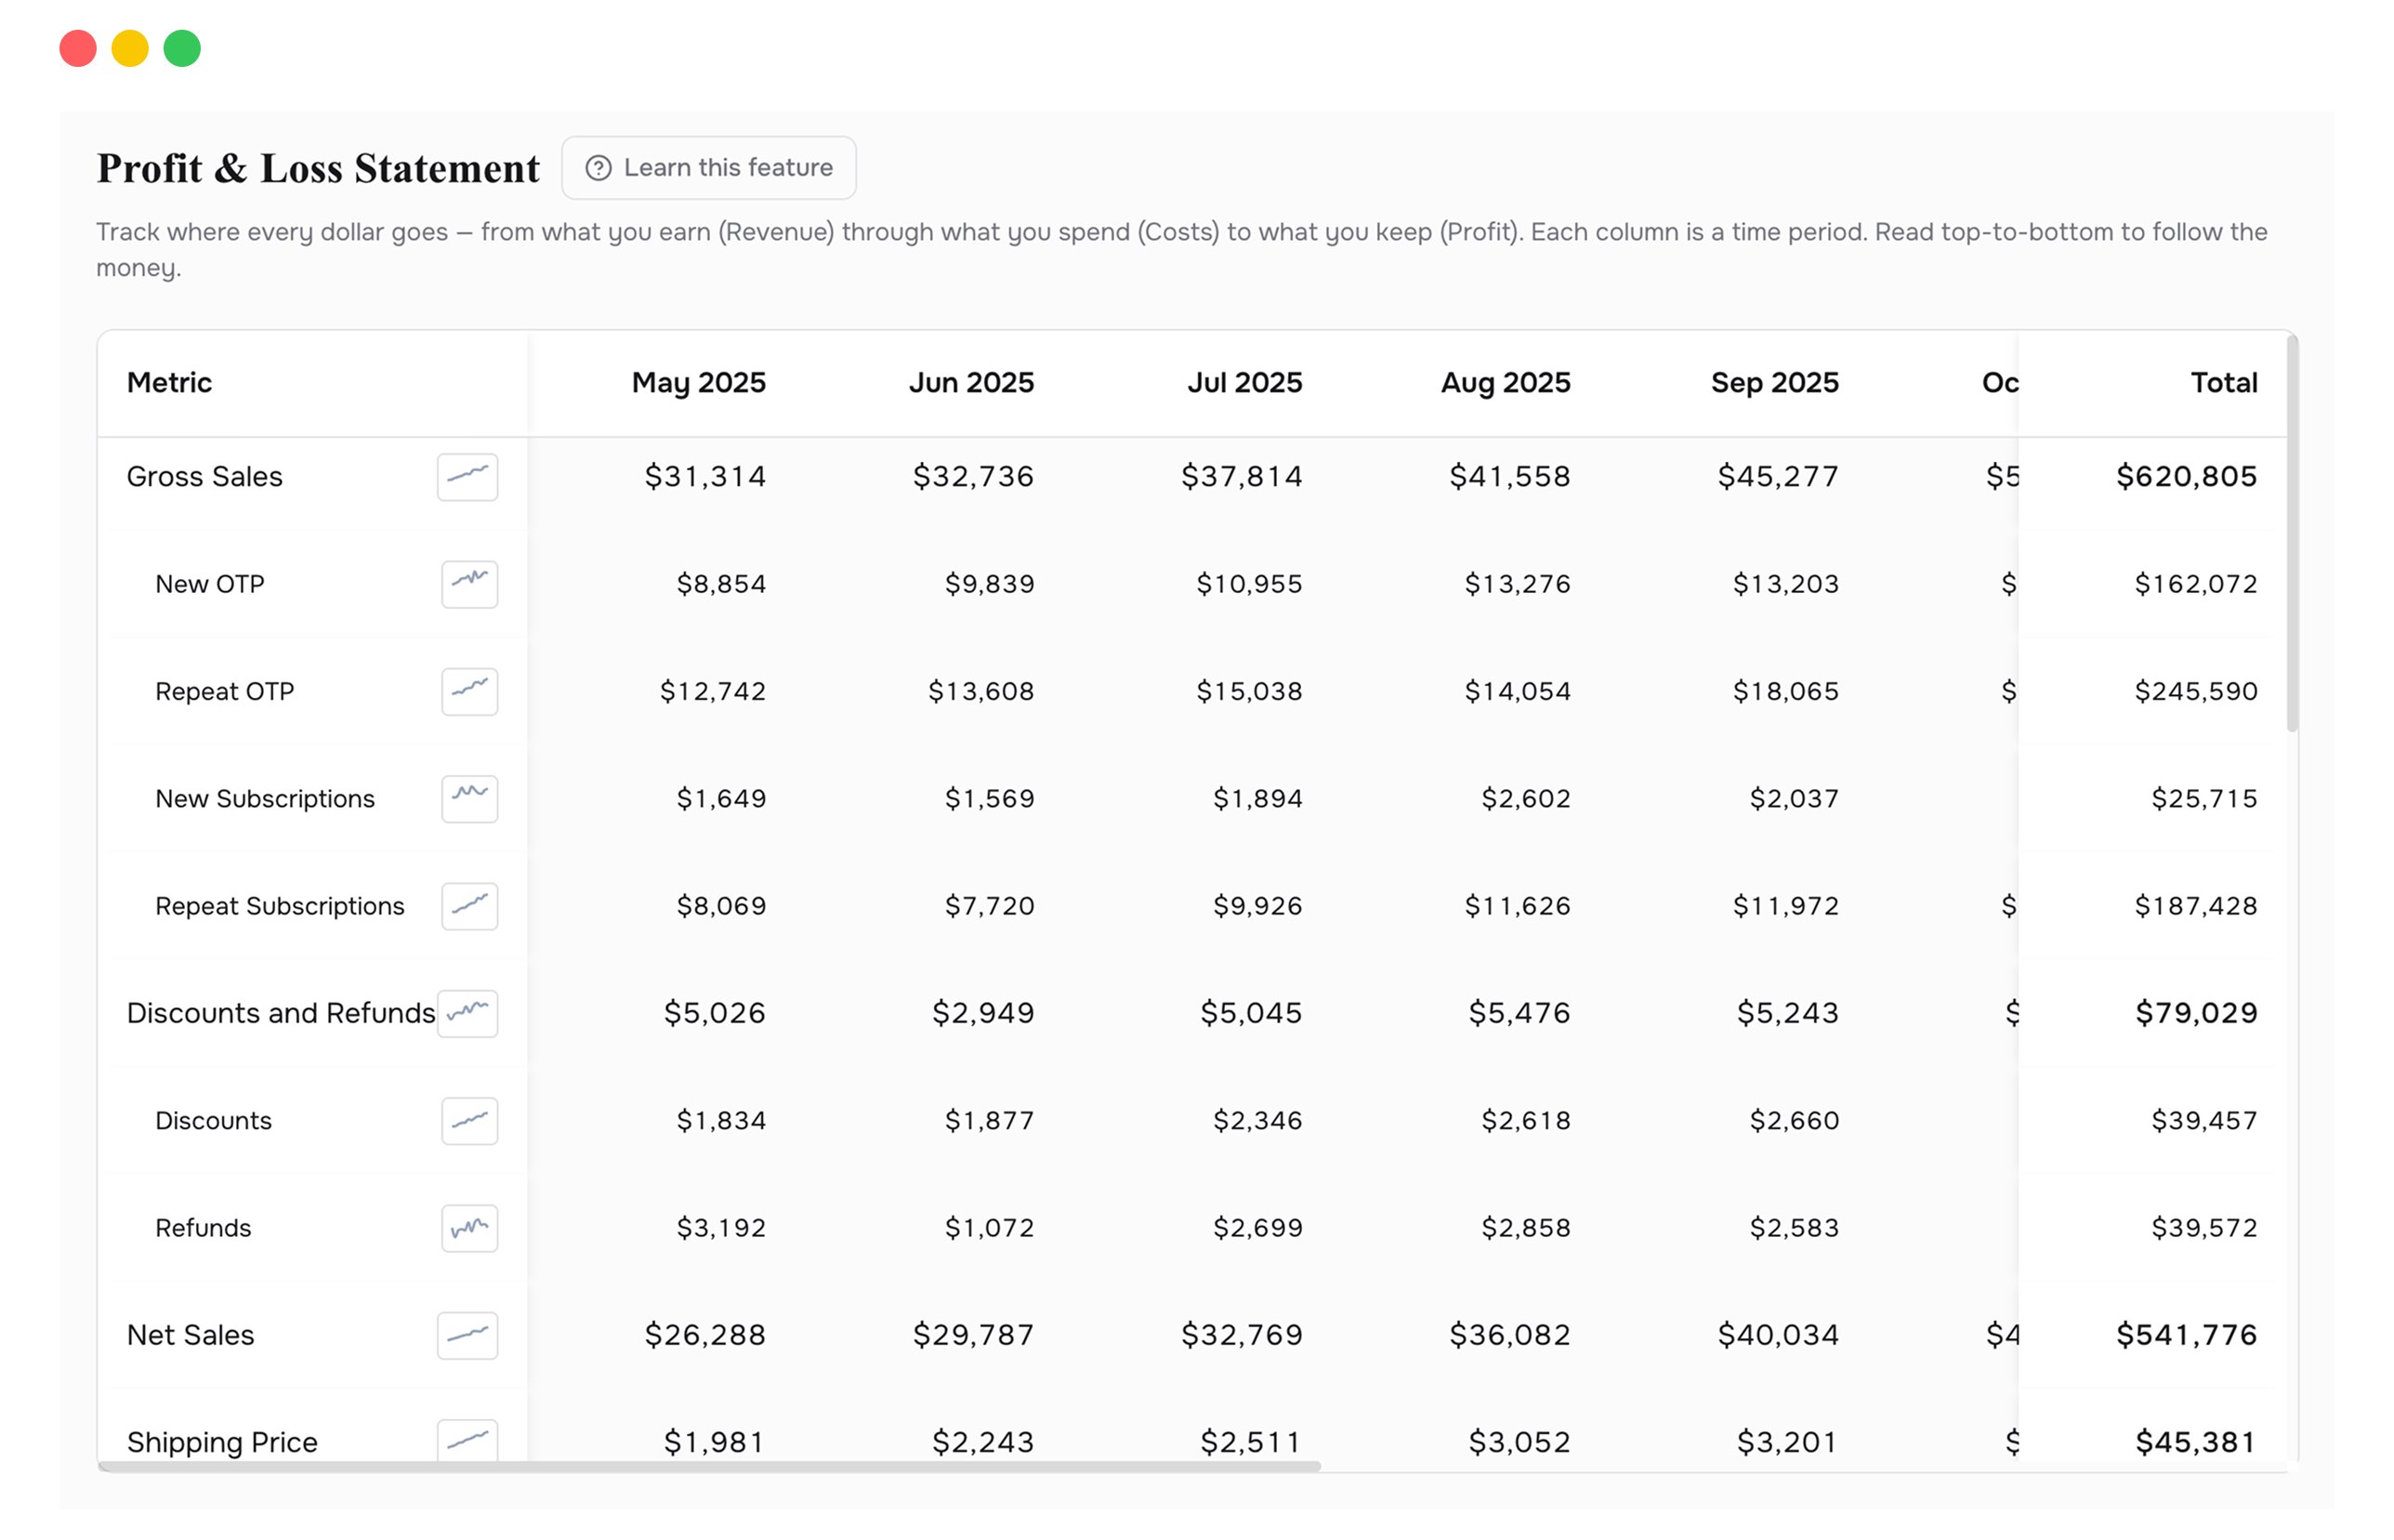
COGS, shipping, handling, transaction fees, marketing, discounts, and refunds. Nothing estimated. Nothing hidden.
Switch between absolute numbers and percentage-of-revenue with one click. Find the levers that scale.
Each line item includes a mini chart showing its trajectory over time. Spot cost creep before it compounds.
See gross sales broken into first-time and returning customers. Understand where revenue actually originates.
Daily, weekly, or monthly breakdowns with sticky totals. Compare any two time ranges instantly.
One click, fully formatted spreadsheet with all periods and metrics. Ready for your accountant or your board.
The most useful number on this page isn't net profit. It's the gap between where you expected net profit to be and where it actually landed. That gap is made up of specific, named cost lines. Usually COGS and fulfillment are the biggest two. A 2% reduction in either one flows directly to your bottom line, and this table shows you which one to prioritize.
The biggest line items are your highest-leverage targets. You don't need to fix everything. Fix the two largest cost lines by a small percentage and the impact compounds across every order.
Toggle to percentage view and look at the fulfillment line. If it's 15% of revenue and climbing, your free shipping threshold might need to move. This table gives you the exact number.
The new vs. repeat split shows you whether repeat customers carry higher margins. They usually do. That insight changes how you allocate your retention budget.
Switch to weekly or monthly grouping and watch the sparklines. When did margins start dropping? Rising COGS? A spike in refunds? The trend surfaces problems a month before they show up in your bank account.
Because fulfillment, platform fees, and marketing cost more than most brands realize. Shopify shows revenue. This shows profit after every cost. The gap between those two numbers is exactly what you're looking at for the first time.
Focus on the biggest cost items first. The table sorts them for you. Usually it's COGS (renegotiate with your supplier or reprice) or fulfillment (optimize box sizes or carrier mix). Fix the largest line item first.
Yes. The export button generates a fully formatted Excel file with all periods and metrics. It's designed to be readable by someone who wasn't in the room when you pulled the data.
Connect your Shopify store in 2 minutes. Your P&L, LTV, unit economics, and forecasts are ready the same day. No credit card required to start.