
12, 24, or 60 Month Horizon
Short-term planning or long-range modeling. Pick the window that matches your decision.
P&L FORECASTING
Your complete P&L projected up to 60 months into the future. Built on your real numbers, not a spreadsheet someone forgot to update. Change an assumption, and the entire forecast recalculates.
Most brands plan their growth around a revenue target. But revenue and profit don't always move together. If sales go up 20% while fulfillment and ad costs rise 25%, you've grown your way into lower margins. Without a forward-looking P&L, you won't see that until the quarter is already over.
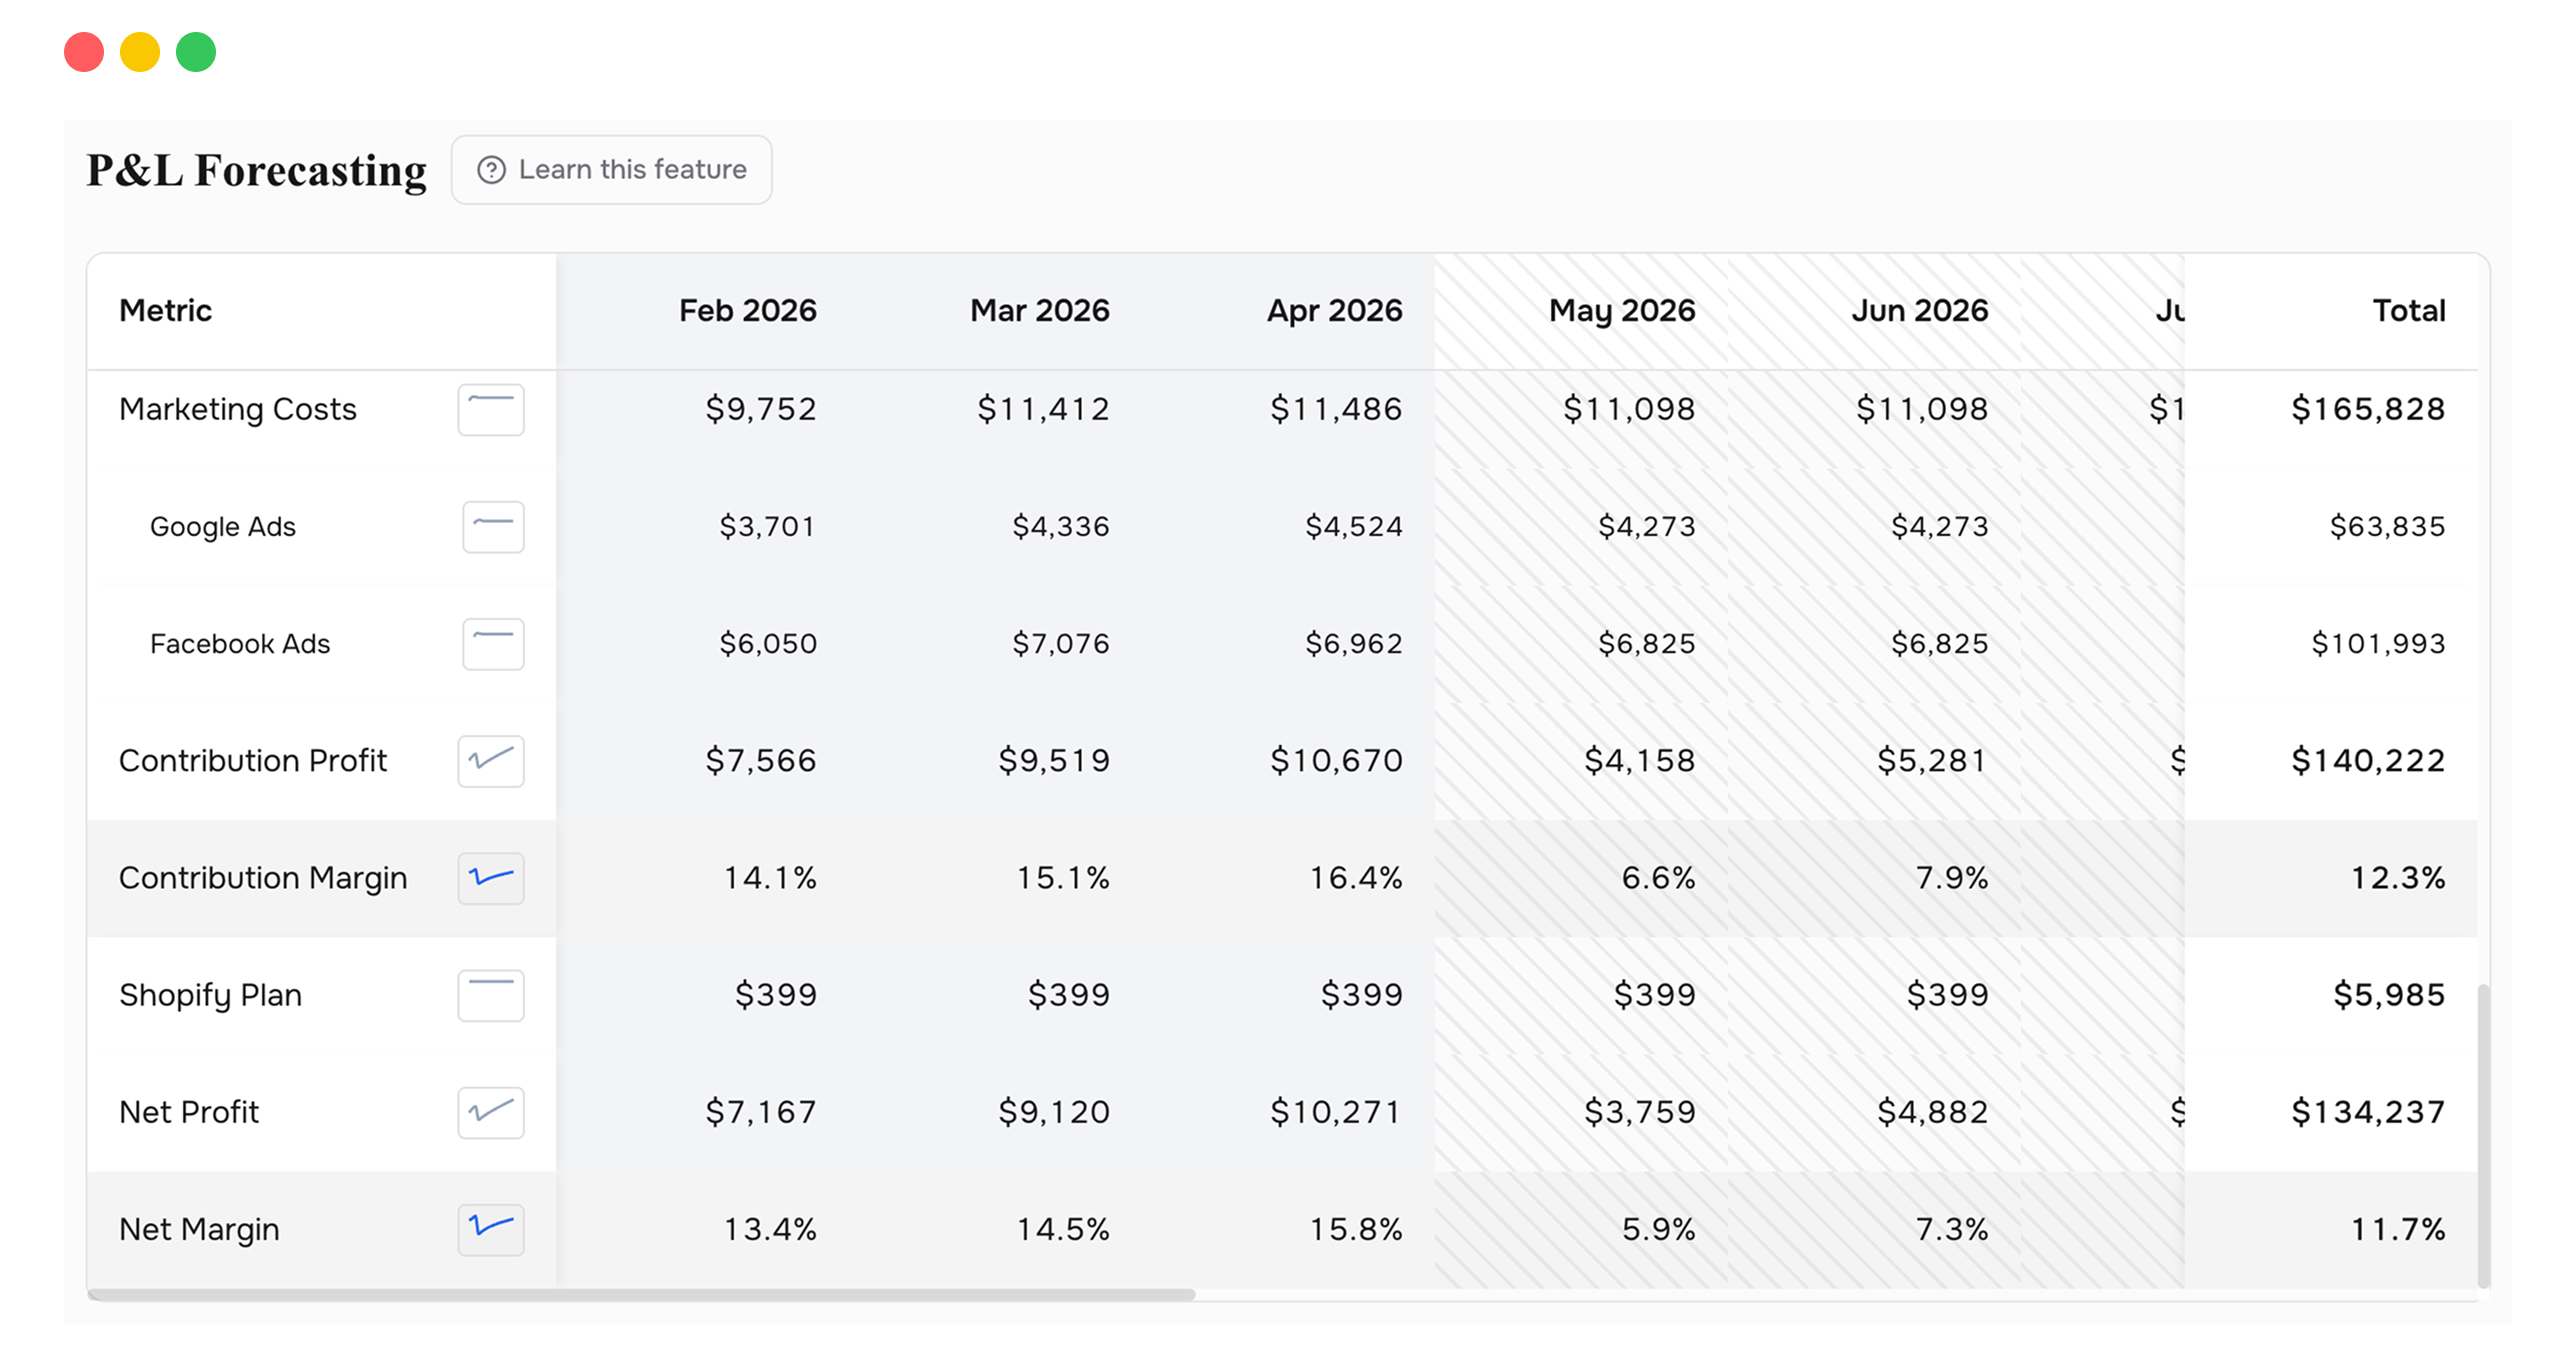
P&L Forecasting extends your actual profit and loss statement into the future. Historical columns show your real numbers. Forecasted columns project every line item forward: gross sales, COGS, shipping, marketing, fees, and net profit. The table reads left to right, from what happened to what's likely to happen, across 12, 24, or 60 months.
The forecast is driven by adjustable assumptions. You set your expected customer acquisition cost, monthly ad spend, and acquisition window. Change any of them and the entire forecast recalculates instantly. Want to know what happens to profit if you increase ad spend by $10K per month? Change the number and read the new bottom line. No spreadsheet formulas, no circular references.
Short-term planning or long-range modeling. Pick the window that matches your decision.
Override the defaults with your own numbers. The forecast rebuilds itself around your assumptions.
Forecasts start from your actual last 3 months of data. Not estimates. Not industry benchmarks. Your real numbers.
Switch between absolute dollars and percentage-of-revenue. Margin compression shows up clearly in percentage view even when dollar amounts are growing.
Optionally scope the forecast to specific customer cohorts for more targeted projections.
Historical and forecasted columns sit next to each other. See exactly where the projection diverges from reality.
The most important thing to find in this table is the month where revenue keeps growing but net profit stops following. That's where a cost line is expanding faster than sales. It could be COGS creep, rising ad costs, or fulfillment getting more expensive at scale. The table shows you which line item is responsible, and the month it starts to hurt.
Open the assumptions panel, increase your projected ad spend by $10K, and read the bottom line. If profit doesn't grow proportionally, the extra spend isn't worth it at your current economics. You'll know before writing the check.
Revenue can grow indefinitely. Profit can't. This forecast shows you the ceiling: the point where adding more customers costs more than they contribute. Knowing that number changes how aggressively you scale.
Whether it's to your co-founder, your board, or yourself, this is a P&L projection built on real data with named assumptions. It's more honest than a spreadsheet and more useful than a guess.
Use percentage view. If net margin drops from 12% to 9% over the next six months while revenue grows, you've found a problem before it lands. Fix the cost line now while you still have time.
The forecast uses your actual last 3 months as the baseline. If that period was unusual (holiday season, a large promotion), the baseline won't reflect typical operations. Switch to custom inputs and enter more representative numbers.
Yes. Change your CAC, ad spend, or acquisition window, and hit Apply. The entire forecast recalculates. You can run as many scenarios as you want by adjusting the inputs.
Yes. The forecast works with Shopify data alone. Connecting Recharge makes the subscriber vs. one-time buyer split more accurate, but it's not required.
Connect your Shopify store in 2 minutes. Your P&L, LTV, unit economics, and forecasts are ready the same day. No credit card required to start.