
Product, Variant, and Collection Views
See profitability at whatever level of detail you need. Start broad, then drill in.
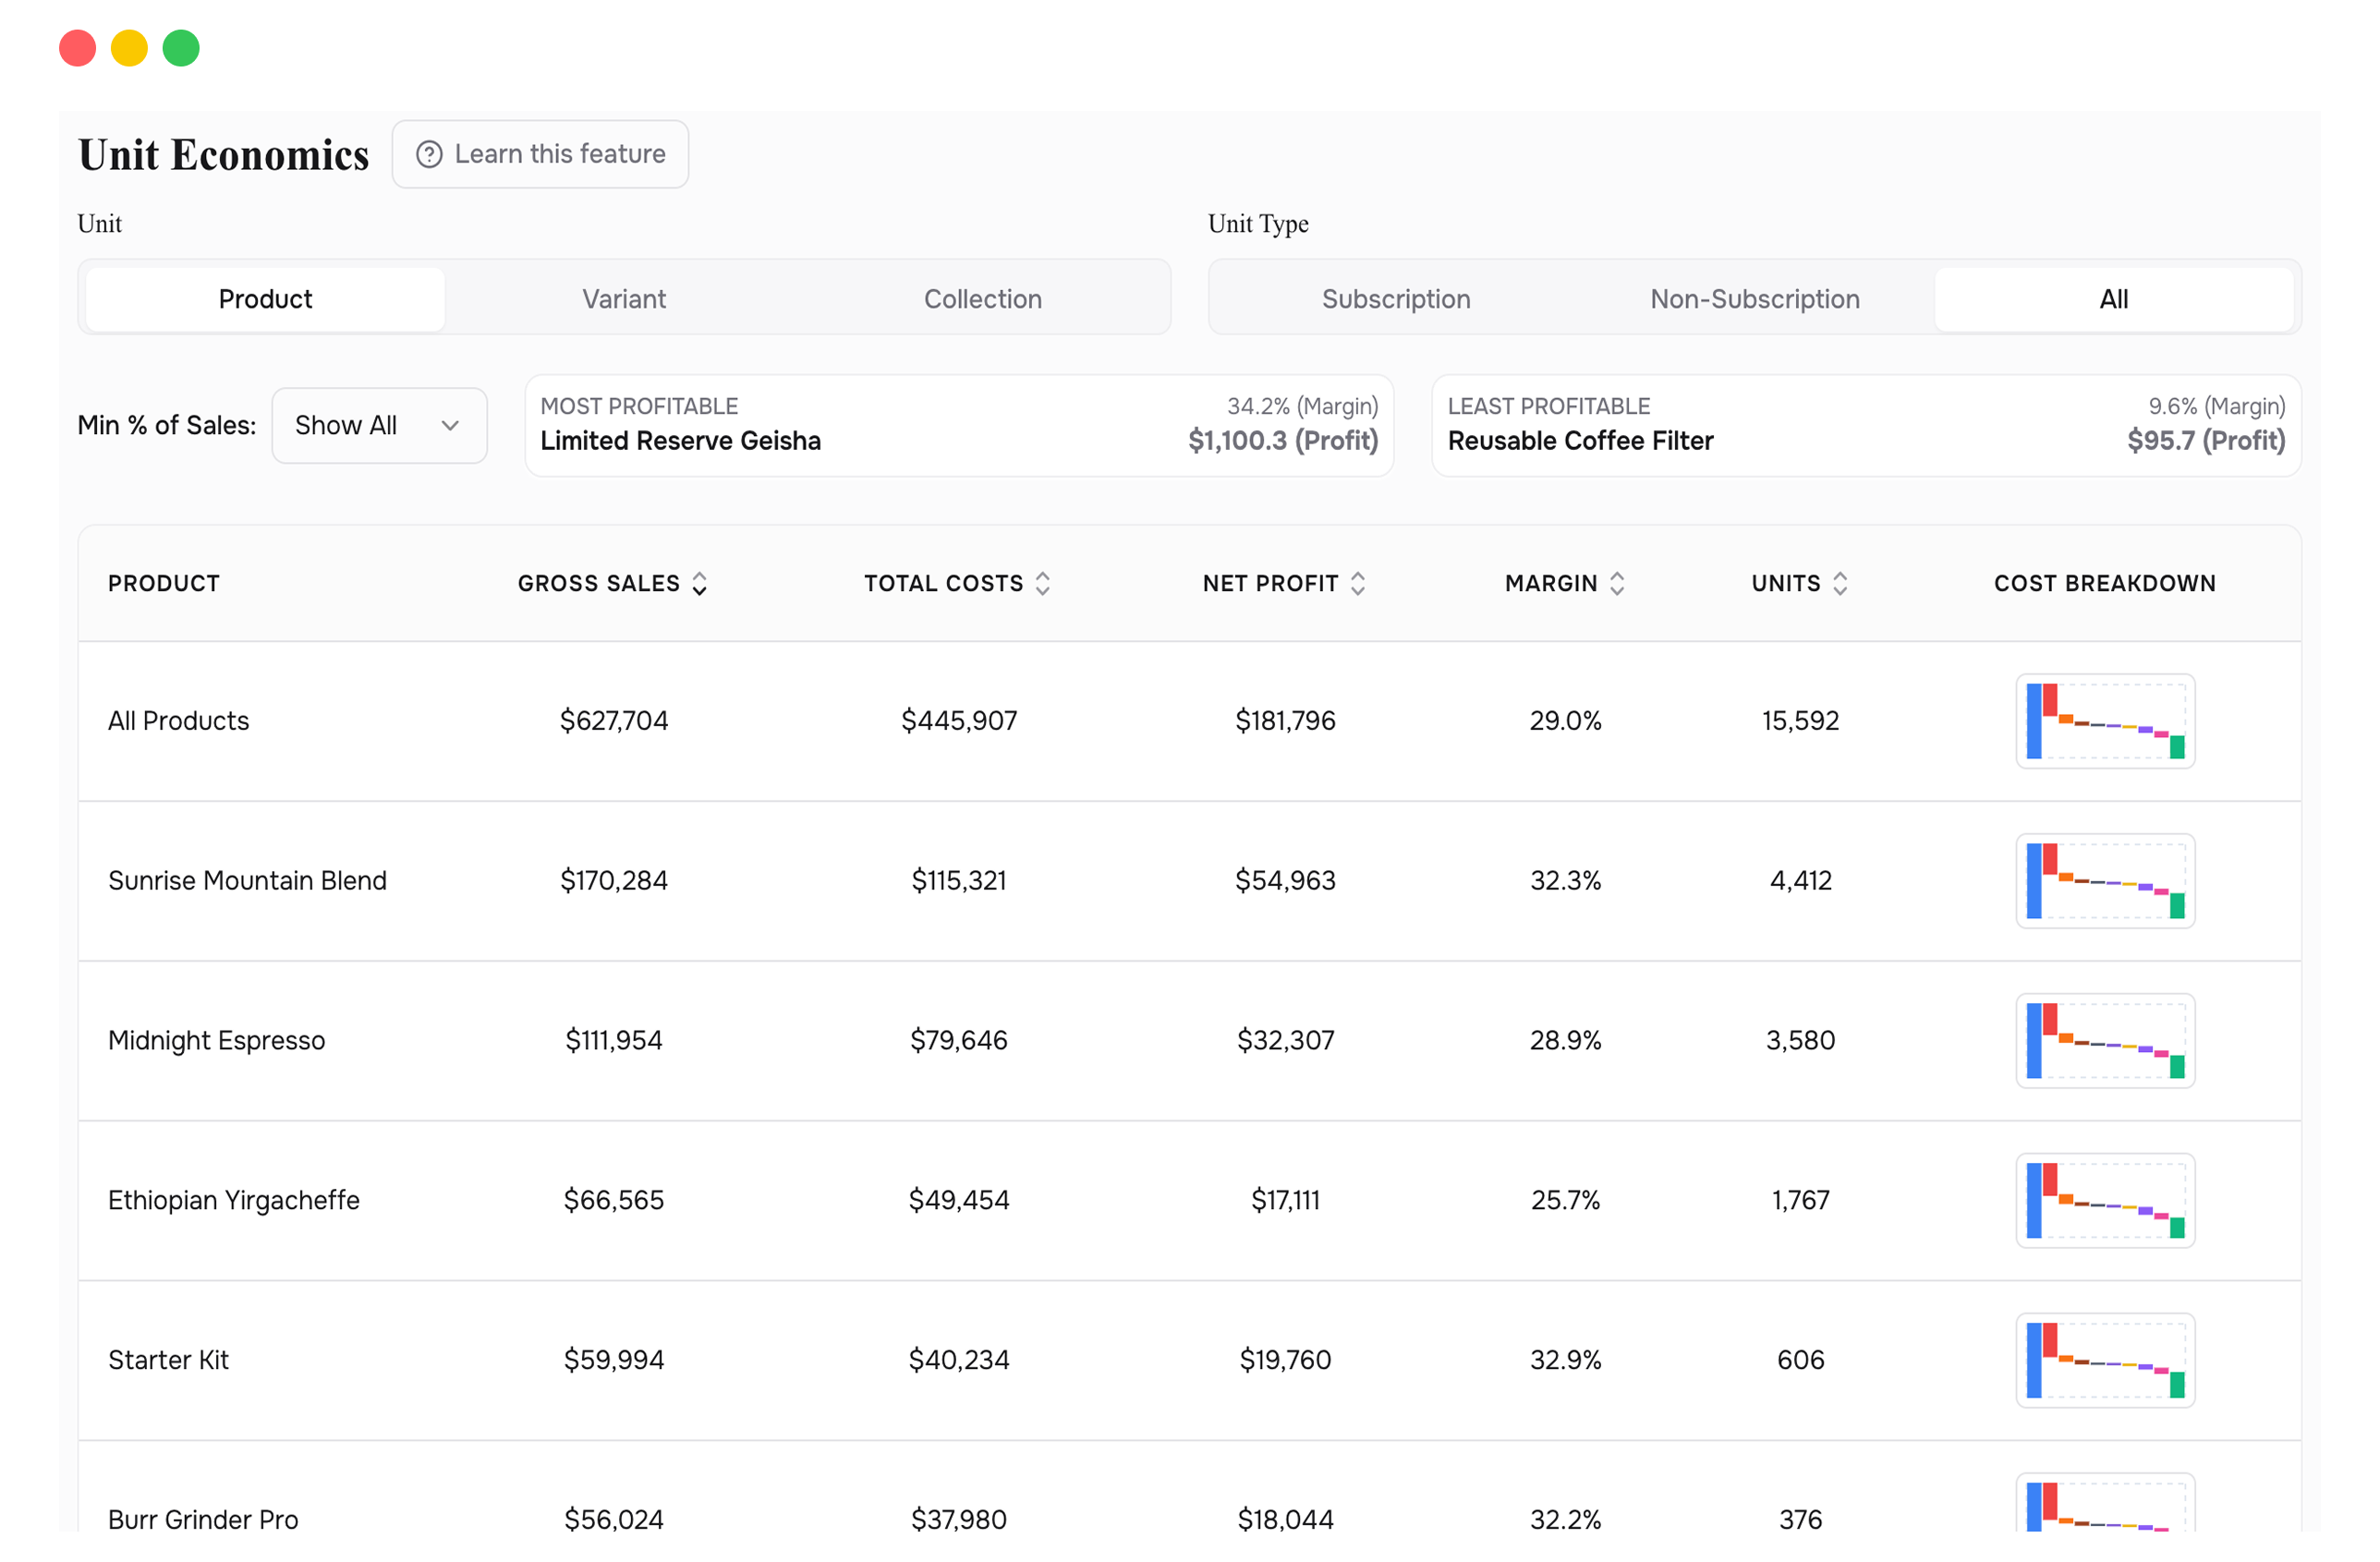
UNIT ECONOMICS
Every product, variant, and collection scored by true profitability after every cost is accounted for. The products you thought were winners might not be. The ones you overlooked might be carrying the business.
You have products that move fast and products that generate high revenue. But once you subtract product cost, shipping, platform fees, discounts, and refunds at the SKU level, the ranking changes. Some of your top sellers are breaking even. Some of your quiet performers are your most profitable items. Without this view, you're optimizing for the wrong products.
Unit Economics shows a profitability table for every product, variant, or collection in your store. Each row includes gross sales, total allocated costs, net profit, units sold, and gross margin percentage. At the top of the page, stat cards highlight your most and least profitable items so you can see the extremes immediately.
The cost allocation is complete. Product cost, shipping (from ShipStation), platform and transaction fees, discounts, and refunds are all broken down per item. You can toggle between product-level and variant-level views to find whether the problem is the whole product line or a single SKU dragging it down. You can also filter by subscription vs. one-time purchases to see if your subscribers are actually more profitable after all costs.
See profitability at whatever level of detail you need. Start broad, then drill in.
Every cost from gross sales to net profit, allocated to each individual product. No aggregates hiding the truth.
The two extremes surfaced instantly. Know your best and worst performers at a glance.
See whether your subscribers are actually more profitable per order once every cost is factored in.
Show products above 0.1%, 1%, or 10% of total sales. Cut the noise and focus on what moves the needle.
Sort by gross sales, net profit, margin, or units sold. The default view shows profit. Change it to answer different questions.
Look for products where the gap between gross sales and net profit is widest, then look at which cost layer is responsible. The answer is rarely what you expect. A product with strong revenue and poor margins usually has one specific cost that's out of line: shipping on oversized items, a persistent 20%-off coupon, or a return rate that never showed up in your revenue reports. The waterfall shows you exactly which one it is.
If net profit is negative and the waterfall shows COGS or shipping as the cause, you know exactly what needs to change and by how much. No guessing, no "gut feel."
If the discount line is consistently large on a product, check this view before your next sale. You'll see what a 20%-off coupon actually costs in margin, not just the revenue it generates.
Switch to variant view. The problem is rarely the entire product. It's usually one size, one color, or one configuration pulling the average down. Fix that variant and the product-level numbers improve.
Use the subscription filter to compare subscriber vs. one-time buyer profitability. If subscribers cost more to serve but generate the same margin, your subscription pricing may need adjustment.
Everything. Shipping (via ShipStation), platform fees, discounts, and refunds are all included and allocated per product. You're seeing the full picture, not just COGS.
Shopify shows revenue. This page allocates every operational cost down to the product level, which Shopify cannot do. The gap between the two numbers is exactly what this page is built to surface.
It filters out low-volume products so you can focus on the items that make up the bulk of your business. Set it to 1% to see products that account for at least 1% of total sales. Set it to 10% to see only your biggest movers.
Connect your Shopify store in 2 minutes. Your P&L, LTV, unit economics, and forecasts are ready the same day. No credit card required to start.